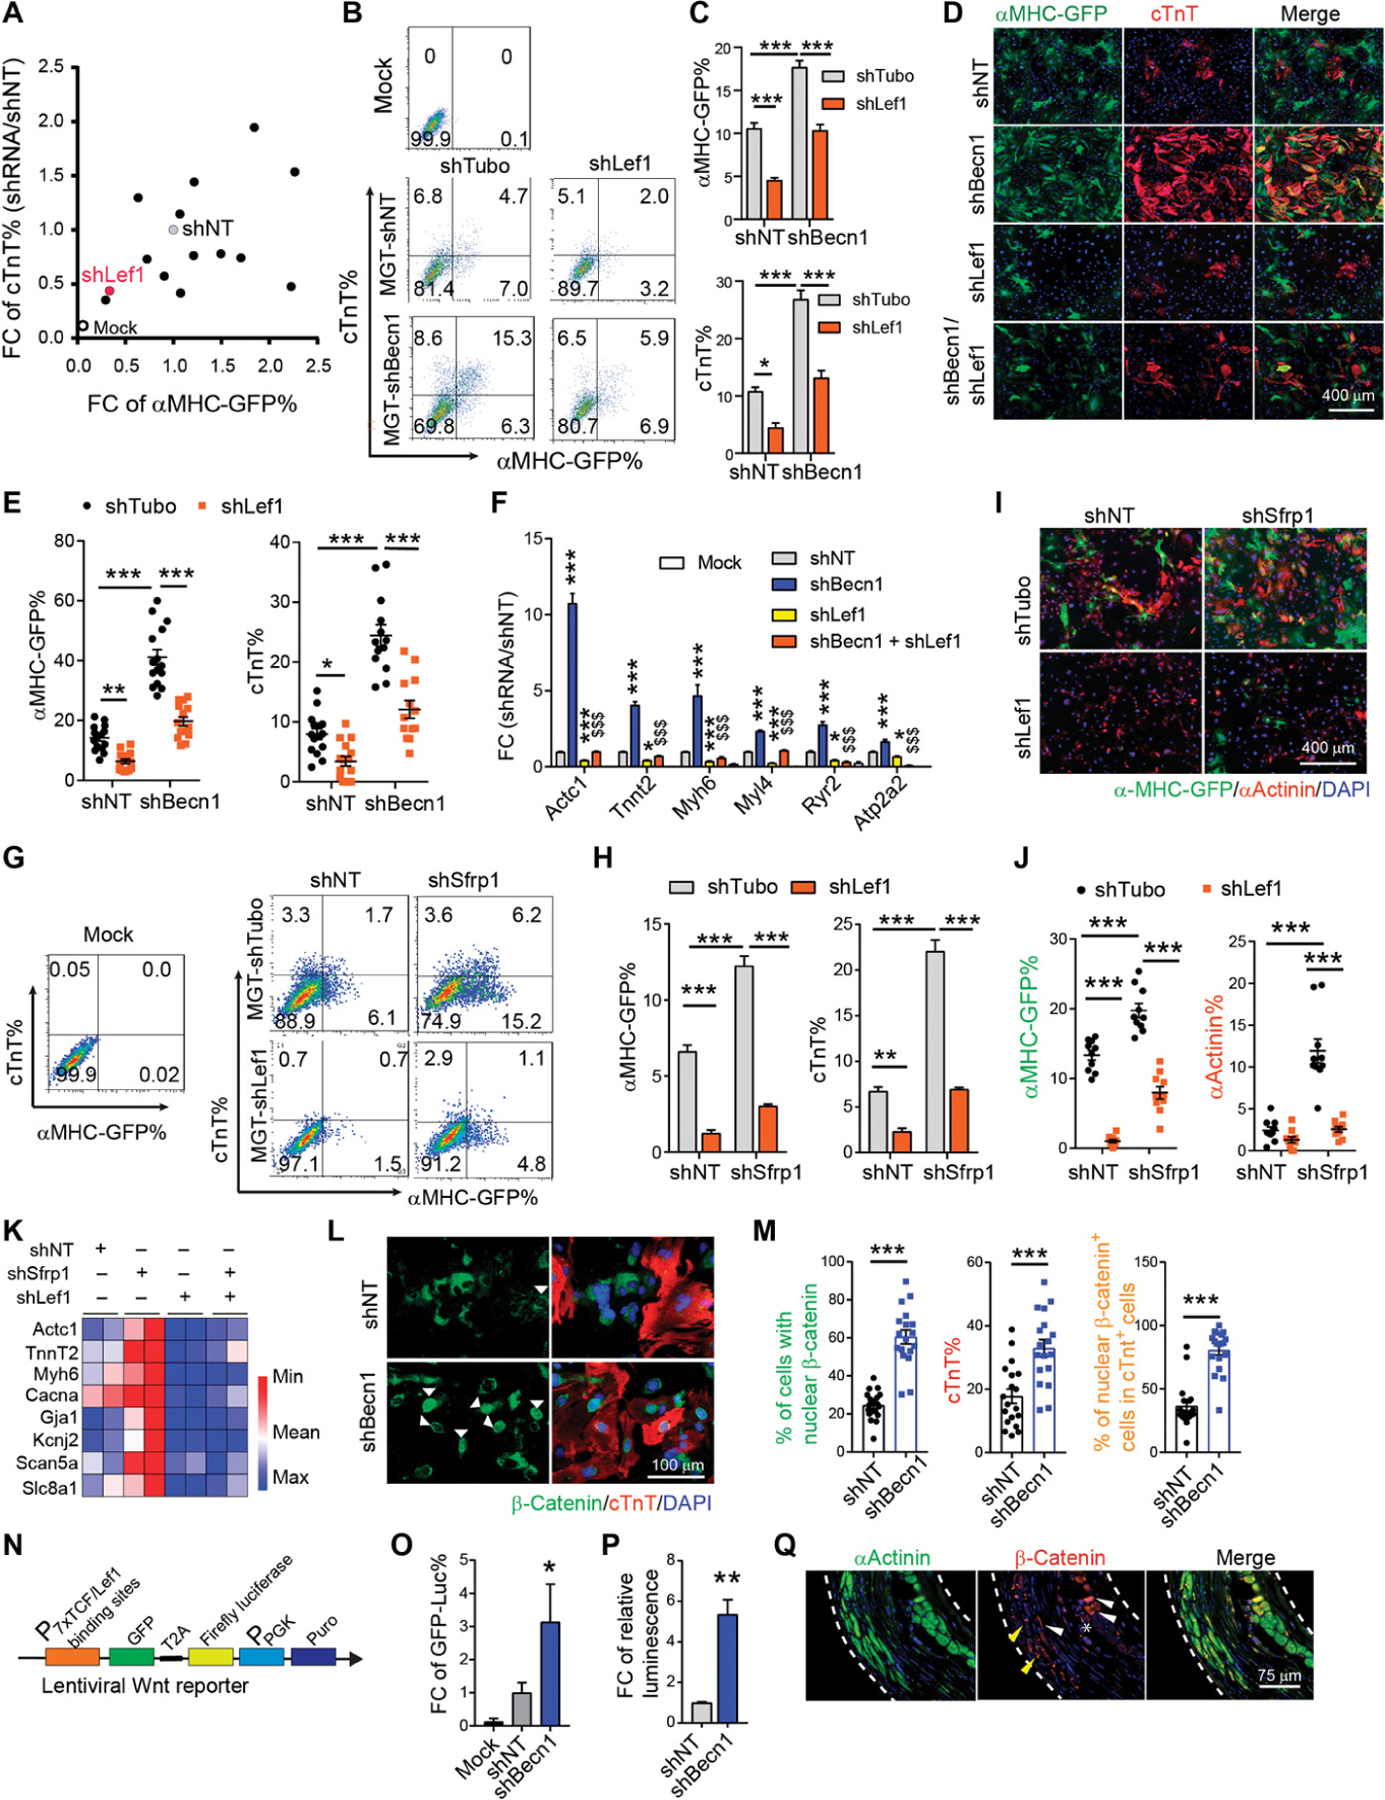
Fig. 7. Becn1 knockdown activated Wnt/β-catenin signaling through regulating the expression of Lef1 and Wnt inhibitors.

(A) shRNA screen for identifying Becn1 downstream effectors. 2D scatterplot showing fold change (FC) in the percentage of αMHC-GFP+ and cTnT+ cells on freshly isolated CFs. (B and C) Representative flow cytometry plots (B) and quantification (C) of αMHC-GFP+ and cTnT+ cells 10 days after MGT and indicated lentiviral shRNA transduction on freshly isolated CFs. (D and E) Representative images (D) and quantification (E) of cells transduced with MGT followed by shRNAs targeting Becn1, Lef1, and both on reprogramming day 14. (F) qPCR for cardiac gene expression in uninfected (mock) or MGT-infected iCMs treated with shNT, shBecn1, shLef1, or shBecn1 + shLef1. *, compared to the MGT+shNT group; $, compared to the MGT + shBecn1 group. (G and H) Representative flow cytometry plots (G) and quantification (H) of αMHC-GFP+ and cTnT+ cells 10 days after MGT transduction and after infection of shRNAs targeting NT, Sfrp1, Lef1, and Sfrp1 + Lef1 on freshly isolated CFs. (I and J) Representative images (I) and quantification (J) of cells as in (G). (K) Heatmap of cardiac gene expression in cells as in (G). (L and M) Representative images (L) and quantification (M) showing nuclear translocation of β-catenin (green) in iCMs positive for cTnT (red). (N) Schematic of lentiviral Wnt reporter construct harboring both GFP and firefly luciferase expression. (O) Quantification of flow analysis showing the FC of GFP-luciferase+ percentage on freshly isolated wild-type CD1 CFs transduced with Wnt reporter on day 14. Cells in the mock group were not infected by any kind of virus. Values were normalized to the MGT + shNT group. (P) Quantification of relative luminescence in cells as in (O). (Q) Representative ICC images showing cellular localization of β-catenin in hearts of Becn1+/− mice 8 weeks after MI and MGT delivery. White dashed line, area of infarct zone; yellow arrowhead, intercalated discs; white arrowhead, cytoplasmic localization; star, nuclear localization. All experiments were repeated at least three times. Mean values from technical triplicates [except n = 10 to 20 for (E), (J), and (M)] were used for statistics. Groups were compared using one-way ANOVA with Tukey’s multiple comparisons test for multiple groups and two-way ANOVA followed by Tukey post hoc test was used for (C), (E), (H), and (J). Error bars indicate means ± SEM; *P < 0.05, **P < 0.01, and ***P < 0.001; $$$P < 0.001.
