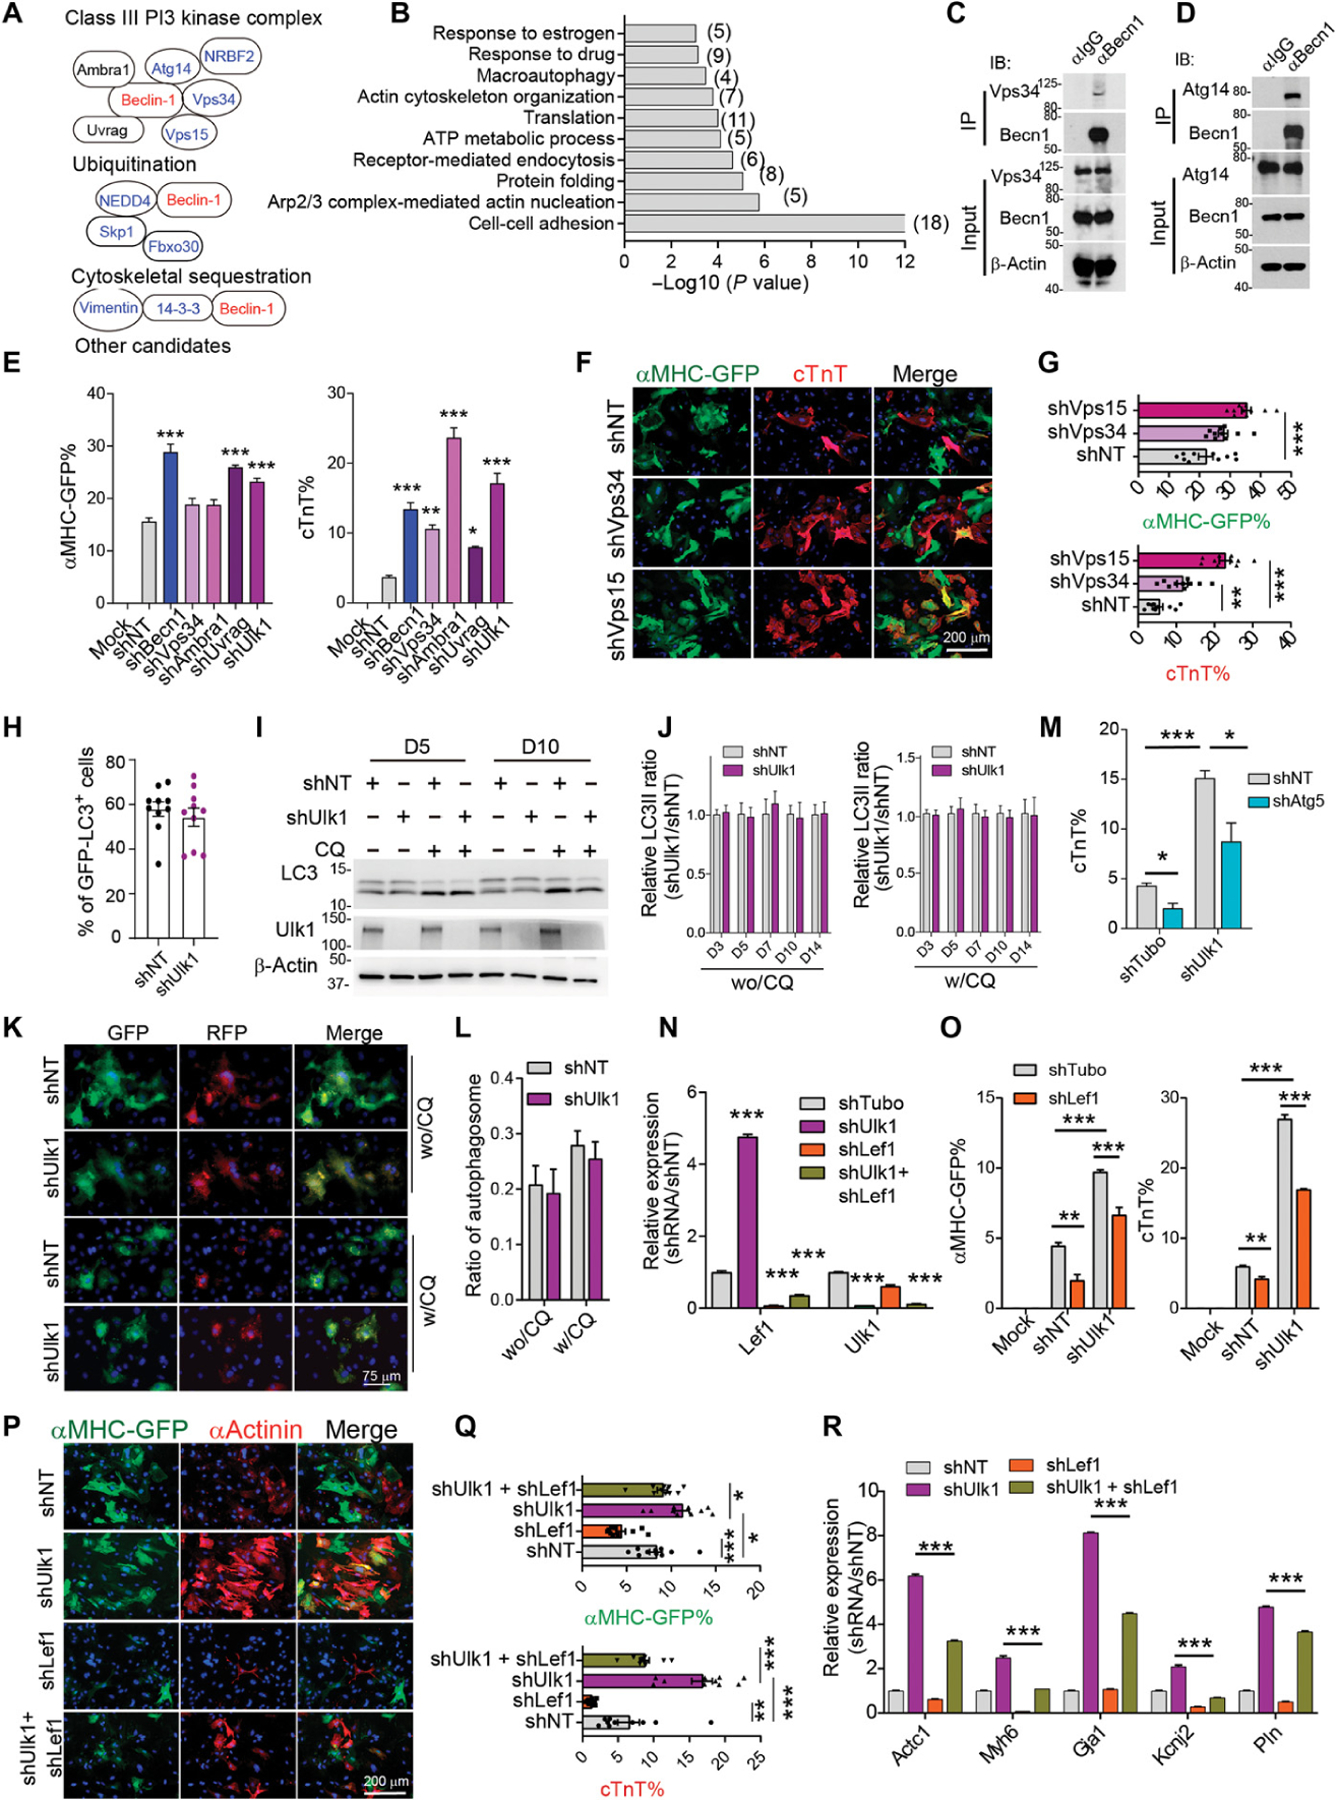
Fig. 8. Becn1 suppresses iCM conversion by interacting with the PI3K complex downstream of ULK1.

(A) Known Becn1-interacting protein identified from mass spectral analysis. (B) Enriched GO terms from potential Becn1 binding partners identified by mass spectral analysis. (C and D) Representative Western blot analysis showing the immunoprecipitation of Becn1 with Vps34 (C) and Atg14 (D) in iCMs 5 days after MGT transduction. (E) Quantification of flow analysis showing the percentage of αMHC-GFP+ and cTnT+ cells 10 days after MGT transduction and after infection of indicated shRNAs targeting the PI3K III complex. (F and G) Representative images (F) and quantification (G) of cells transduced with MGT followed by infection of shRNAs targeting NT, Vps35, and Vps15 on reprogramming day 14. (H) Quantification of GFP-LC3 puncta formation in iCMs treated with shUlk1 or shNT at reprogramming day 5. (I) Representative Western blot showing the autophagy flux in iCMs treated with shUlk1 or control shNT on reprogramming day 5 and day 10. (J) Quantification of autophagy flux detected by Western blot in iCMs with Ulk1 knockdown from day 3 to day 14. wo/CQ, without CQ treatment; w/CQ, with CQ treatment (20 µm) for 4 hours. (K and L) Representative images (K) and quantification (L) showing the formation of autophagosomes in iCMs upon Ulk1 knockdown in the presence or absence of CQ treatment. (M) Quantification of flow analysis showing the percentage of cTnT+ cells 10 days after MGT plus indicated shRNA transduction. (N) qPCR analysis of Lef1 and Ulk1 expression in cells as in cells treated with indicated shRNA. (O) Quantification of FACS analysis showing the percentage of αMHC-GFP+ and cTnT+ cells 10 days after MGT plus indicated shRNAs transduction. (P and Q) Representative (P) and quantification (Q) of ICC images showing the percentage of αMHC-GFP+ and cTnT+ cells 14 days after MGT and indicated shRNA transduction. (R) qPCR analysis of indicated cardiac gene expression in cells treated as in (P). All experiments were repeated at least three times. Mean values from technical triplicates [except n = 10 to 15 for (G), (J), (M), and (Q)] were used for statistics. Groups were compared using two-tailed unpaired t test or one-way ANOVA with Tukey’s multiple comparisons test for multiple groups and two-way ANOVA followed by Tukey post hoc test was used for (K) and (O). Error bars indicate means ± SEM; *P < 0.05, **P < 0.01, and ***P < 0.001.
