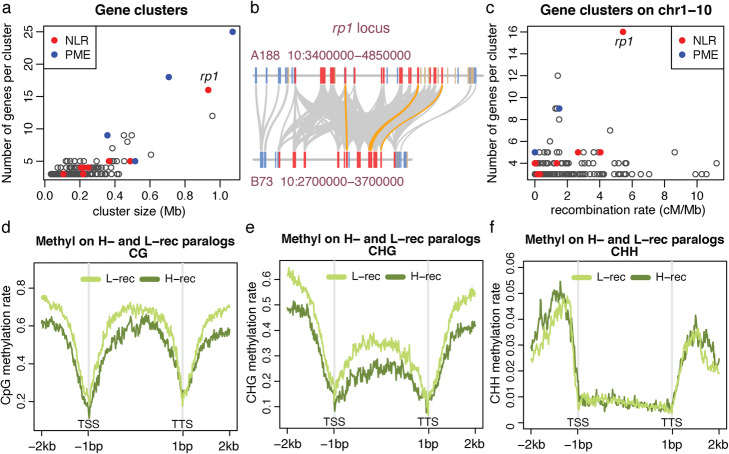
Fig. 4.
Gene clusters and paralogs in low- and high-recombination regions. a The scatter plot of numbers of genes per cluster versus their cluster size. b Example of an NLR gene (rp1) cluster in A188 and their alignments with the B73 rp1 locus. Each rectangle box represents a gene with blue, tan, and red colors indicating plus, minus orientation, and rp1 homologous genes, respectively. All rp1 homologs are in the same minus orientation. Gray bands connect orthologs and orange bands highlight the top rp1 alignments with at least 98.5% identity and a 2500-bp match. c The scatter plot of numbers of genes per cluster versus the recombination rate estimated 1 Mb around the midpoint of the cluster. All clusters plotted are on 10 chromosomes. d–f Distribution of cytosine methylation in sequence contexts of CG, CHG, and CHH around paralogous genes. An average methylation rate per window across all examined genes from two replicates of seedling samples was determined and plotted versus the window order. A window in the gene body, from translation start site (TSS) to translation termination site (TSS), is 1/200 of the gene body in length. A window outside of the gene body is 20 bp

