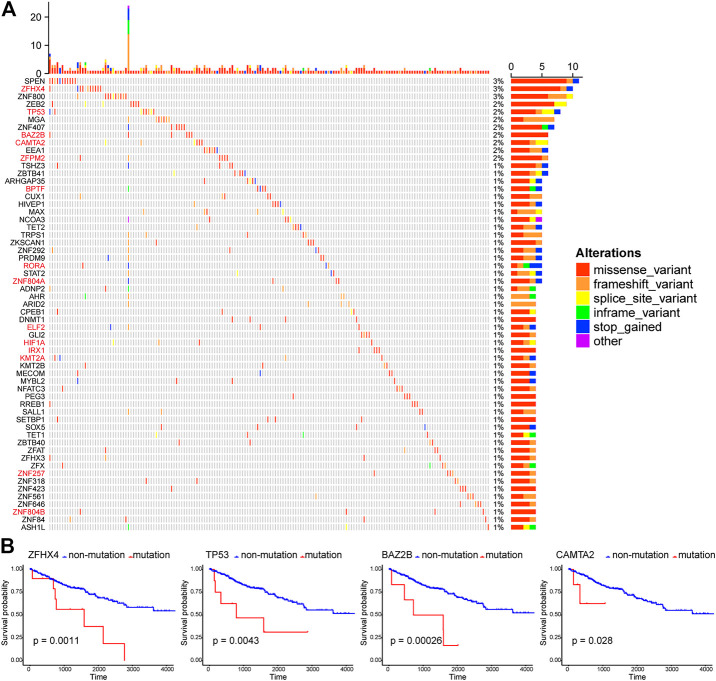
FIGURE 2.
Patterns of gene mutations in ccRCC. (A) The Oncoprint chart shows the top 60 TF genes with most mutations in the TCGA KIRC cohort. The horizontal axis means KIRC patients, and the vertical axis means the proportion of patient samples with a certain genetic mutation. (B) OS analysis of the mutations of the four representative TF genes with the most mutations (ZFHX4, TP53, BAZ2B, and CAMTA2). They are all statistically significant.

