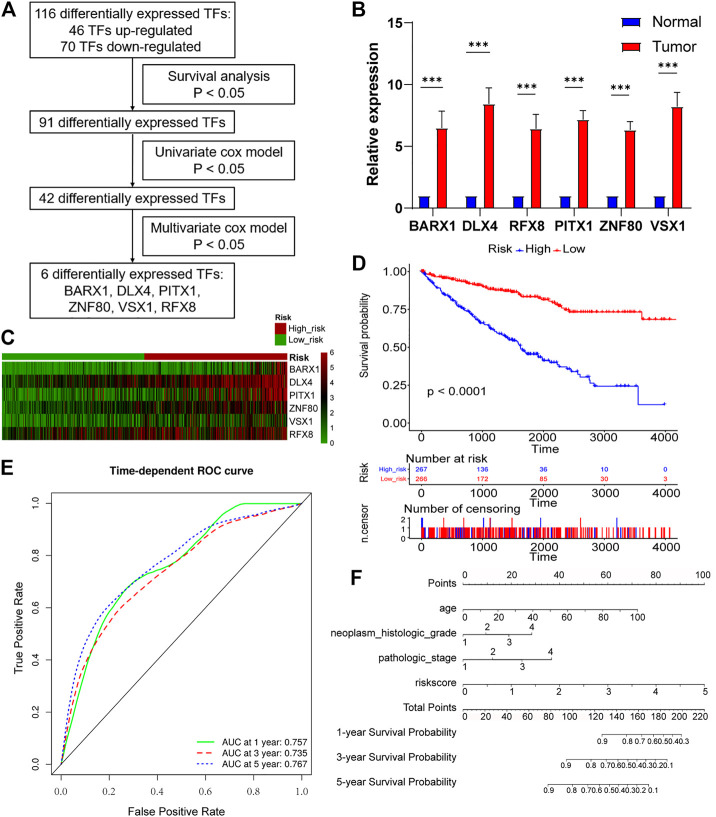
FIGURE 4.
Six-TF–based panel as a prognostic model for OS in ccRCC. (A) The process to identify TF genes that significantly correlated to OS. (B) Real-time polymerase chain reaction (RT-PCR) is performed in 16 paired tumor and matched adjacent normal tissues. BARX1, DLX4, PITX1, ZNF80, VSX1, and RFX8 are upregulated in tumor tissues. (C) Patients in the TCGA KIRC cohort were divided into high-risk group and low-risk group. Expression profile of 6 TFs (BARX1, DLX4, PITX1, ZNF80, VSX1, and RFX8) in high-risk and low-risk patients is shown. (D) The Kaplan–Meier plot shows the OS in high-risk and low-risk patients in the TCGA KIRC cohort. (E) Time-dependent area under the receiver operating characteristic (AUROC) curve is plotted to evaluate the prognostic value of the 6-TF gene prognostic signature for OS. The area under the curve (AUC) at one, three, and five years is 0.757, 0.735, and 0.767, respectively. (F) The prognostic nomogram of the 6-TF model for OS at 1, 3, and 5 years.

