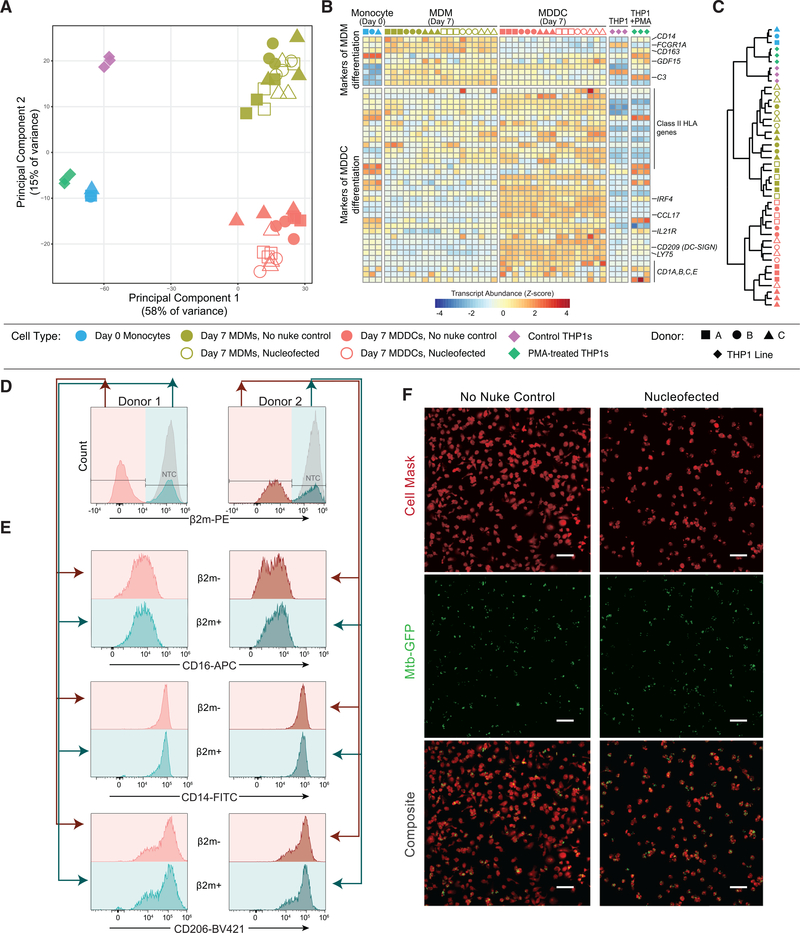
Figure 2. CRISPR-Cas9-mediated gene knockout preserves key aspects of differentiation and function in targeted myeloid cells.
(A) Principal-component analysis of RNA sequencing (RNA-seq) from the indicated cell types.
(B) Normalized transcript abundance (Z score) for selected markers of MDM or MDDC differentiation (Lehtonen et al., 2007).
(C) Dendrogram of hierarchical clustering of the data in (B) by Euclidean distance.
(D and E) Among cells subjected to CRISPR-Cas9 RNP nucleofection, cell surface protein levels of CD16, CD14, and CD206 were compared between the cells that bear the desired β2 m knockout (pink) and those that do not (teal) by flow cytometry after 7 days of MDM differentiation. (D) shows gating, while (E) shows the expression of the indicated markers.
(F) Representative images of unperturbed (left) and RNP-nucleofected (right) MDMs infected with GFP-expressing M. tuberculosis (Mtb-GFP) show that CRISPR-Cas9-targeted cells remain competent to phagocytose living pathogens. Top, membrane staining with Cell Mask Far Red; CENTER, Mtb-GFP; bottom, composite. Scale bars represent 100 μm.
See also Figure S2.

