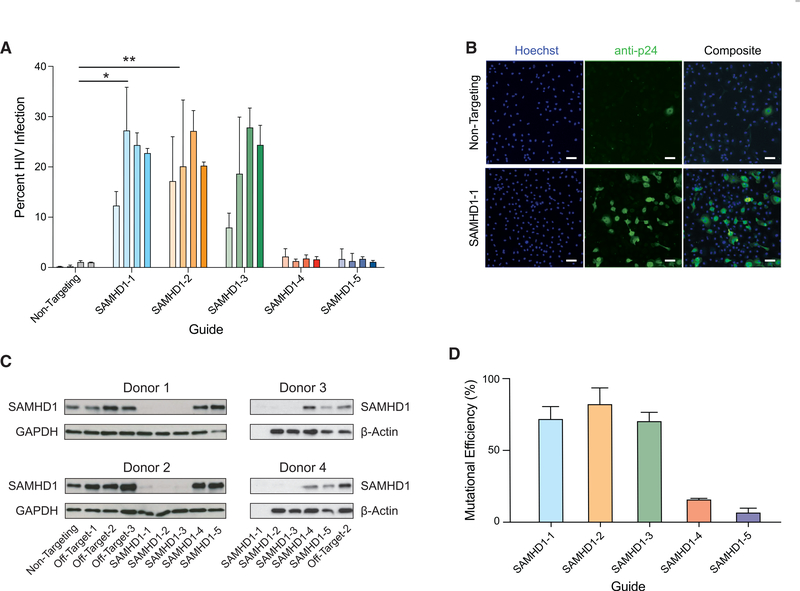
Figure 3. Generation of isogenic monocyte-derived macrophages for functional evaluation of an HIV-1 host restriction factor.
(A) SAMHD1-targeted or non-targeting control MDMs from 4 independent, HIV− blood donors were infected with HIV-1. The plot displays the percentage of cells productively infected after a 48-h exposure. Guides that most efficiently ablated the gene caused statistically significant increases in infection as assessed by 1-way ANOVA followed by Dunnett’s test. *p < 0.05, **p < 0.01. See also Figure S3E.
(B) Representative images of HIV-1 infection from donor 3 comparing cells nucleofected with control non-targeting RNPs (top) to cells nucleofected with RNPs made from guide SAMHD1–1 (bottom). Left, Hoechst; center, staining of the HIV-1 antigen p24; right, composite. Scale bars represent 100 μm. For representative images of all of the guides, see Figure S3D.
(C and D) Quantification of SAMHD1 knockout by immunoblot (C) and sequencing (D). No protein sample was available for guide SAMHD1–1 in donors 3 and 4; Sanger sequencing was analyzed for mutational efficiency by TIDE, bars represent means ± SDs for at least 3 biological replicates.
See also Figure S3.

