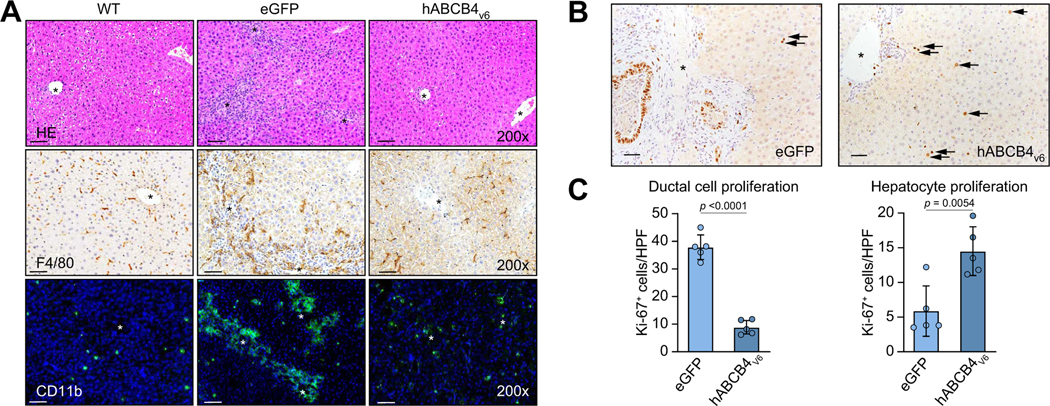
Fig. 6. Resolution of inflammatory infiltrates and improved hepatocyte-driven liver regeneration in BALB/c.Abcb4−/− mice treated with hABCB4v6 mRNA.
(A) Representative images (×200) of H&E (upper row), F4/80 (middle row) and CD11b (lower row). (B) Representative images of IHC for nuclear cell proliferation marker Ki67 staining (×200). Arrows show Ki-67+ replicating hepatocyte nuclei. (C) Quantification of ductal cells vs. hepatocyte replication in situ. Data are average of at least 10 random HFP/animal analysed at 200× magnification, mean ± SEM (n = 5 mice per group, t test p value as indicated). Scale bar, 50 μm. Portal vein indicated by asterisks. hABCB4, human ATP-binding cassette 4; IHC, immunohistochemistry; WT, wild-type.

