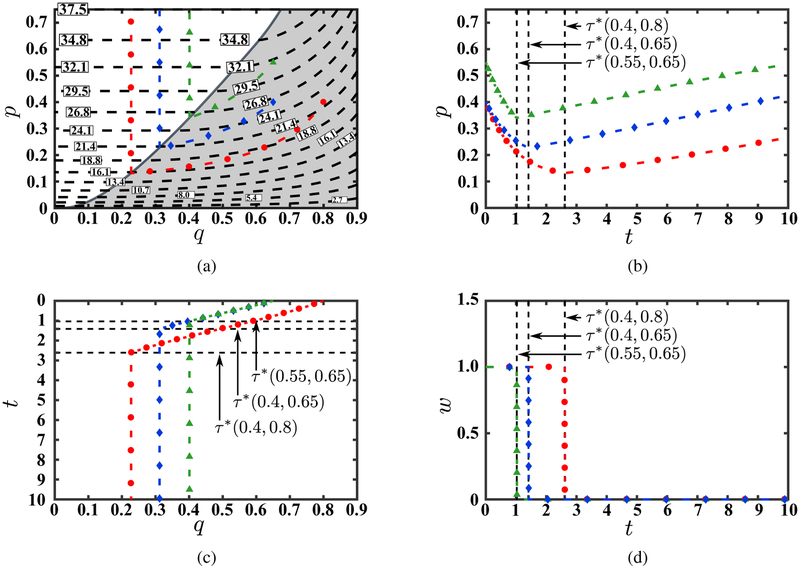
Figure 11:
The optimal state trajectory for three different starting points from four perspectives: (a) in the state space; (b) in the p-dimension as a function of time; (c) in the q-dimension as a function of time; and (d) of the optimal control as a function of time. Panel (a) also illustrates iso-curves of the optimal value function. To enable comparison, p-axis and q-axis in panels (b) and (c) are kept parallel to these axes in panel (a).

