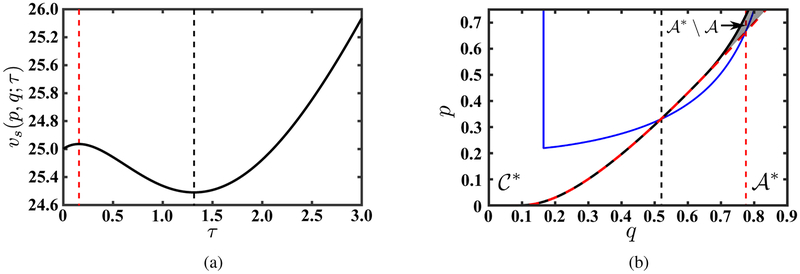
Figure 2:
(a) The value function for an arbitrary switching time τ when the initial point (p, q) is (0.75, 0.8) and(b) the system trajectory when the switching time τ = 3. For any switching time τ < 3, the state of the system remains on the blue line for t ≤ τ after which moves vertically toward p∞ = 0.75, i.e., Q(t) = Qa(τ; 0.8) and P (t) = Pc(t − τ; Pa(τ; 0.75, 0.8)), t > τ. The two vertical dashed lines indicate the time when the state of the system enters and exits . Panel (a) and (b) together illustrate that although initially vs(0.75, 0.8; τ) is increasing in τ, it will eventually decrease as the system trajectory is “strongly entering”.

