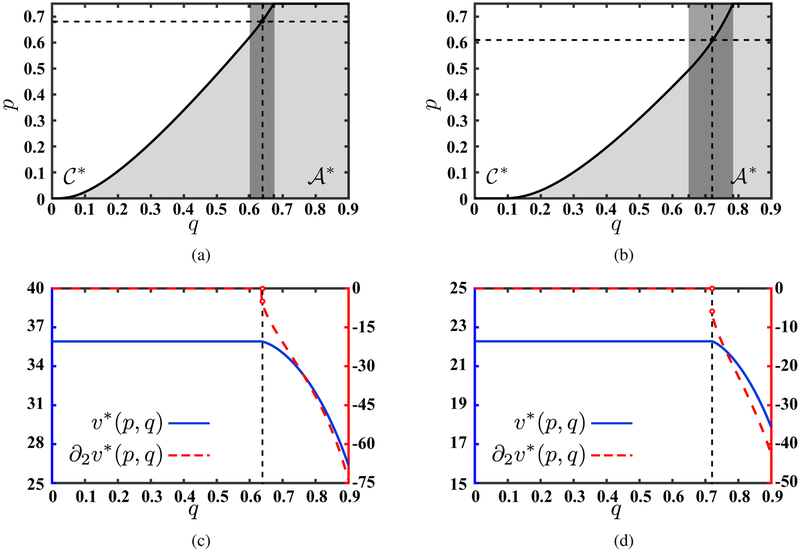
Figure 3:
Action/Inaction regions for (a) long-term focused planner (ρ1 ≤ β − r) and (b) short-term focused planner (ρ2 > β − r). In these two panels is indicated by gray the dark rectangle. The white area denotes the optimal inaction (continuation) region while the gray shading on the right-hand side of the solid line denotes the optimal action region. The optimal value function as a function of q and its first derivative when ρ1 ≤ β − r and p = 0.68 (the horizontal dashed line in panel (a)) as well as when ρ2 > β − r and p = 0.61 (the horizontal dashed line in panel (b)) are shown in panels (c) and (d), respectively. In panels (c) and (d), the left vertical axis represents v* and the right vertical axis represents its first derivative. In these panels a vertical dashed line has been added (at q = 0.64 and q = 0.72, respectively) drawing attention to the the non-differentiability of v* with respect to q at these points. Moreover, in panels (c) and (d) v*(0.68, q) and v*(0.61, q) are constant when q ≤ 0.64 and q ≤ 0.72 respectively as in the inaction (continuation) region , v*(p, q) = vc(p).

