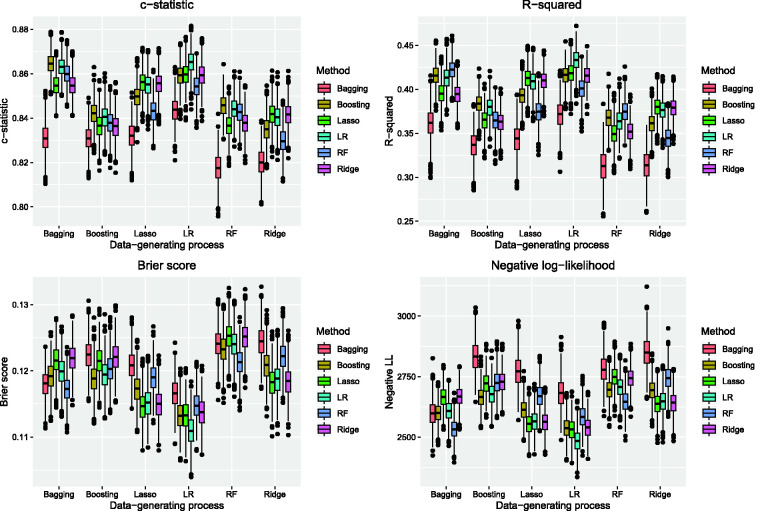
Figure 1.
AMI sample: model performance assessed using c-statistic, R-squared, Brier score, and negative log-likelihood. (There are eight panels across each pair of figures, one panel for each of the eight metrics of model performance. Each panel consists of six sets of six box plots. Each box plot describes the variation in the given performance metric across the 1,000 simulation replicates when a particular data-generating process and analytic method were used.)

