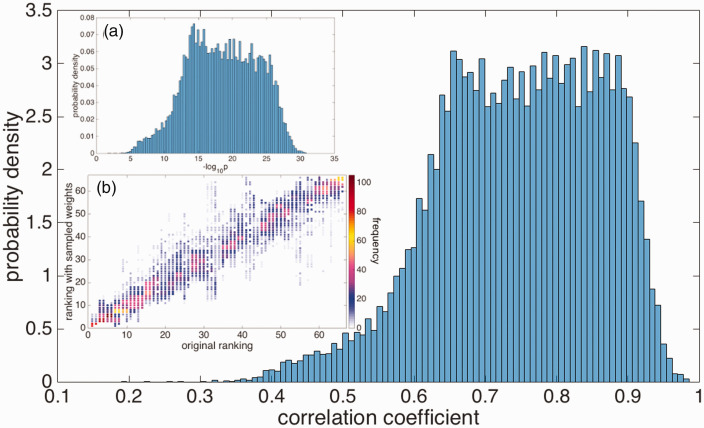
Figure 5.
The distribution of Kendall’s τ correlation coefficients between the antibody rankings using randomized weights with , and the initial ranking using . Inset (a): The corresponding distribution of (minus) the logarithm of the statistical significance (p-values). Inset (b): Color-coded scatter plot corresponding to the datasets that give rise to the Kendall’s τ distribution in the main panel. Frequency (%) color bar is on the right.

