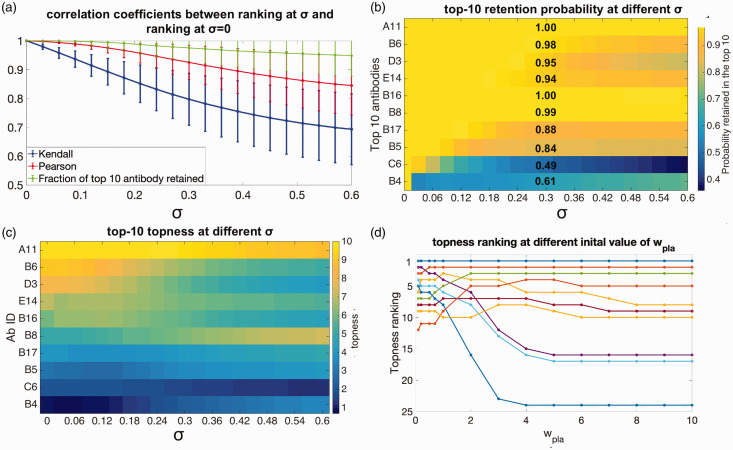
Figure 6.
Robustness of the selected antibodies (a) mean values of the Pearson’s (red curve) and Kendall’s (blue curve) correlation coefficients, between the antibody rankings using our initial guesses for the weights, and for rankings obtained by randomizing the weights to degree σ. Green curve: Average fraction of the top 10 antibodies retained after randomizing the weights to degree σ. (b) The probability antibody candidates are retained in the top 10, as a function of the error in the weights σ, plotted according to the color scale on the right. The retention probabilities at are explicitly given. (c) The topness (t10) values for the antibodies in panel (b), plotted according to the right color bar scale as a function of increasing σ. (d) The topness ranking result for the antibodies as the initial weight wpla is varied over a large range .

