
Figure 4.
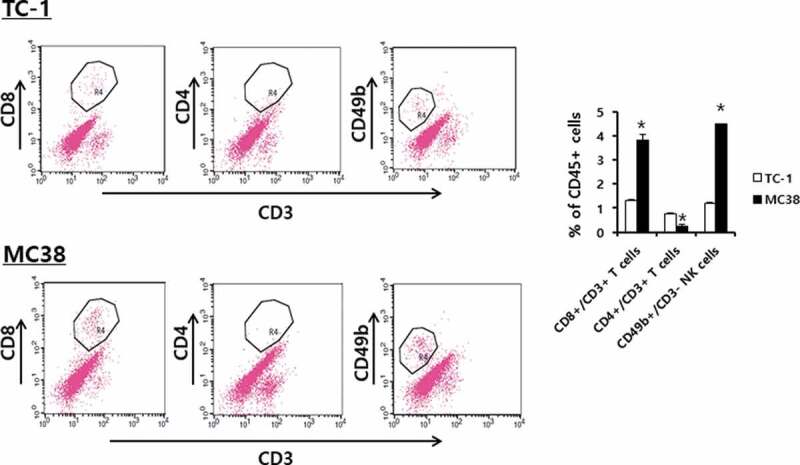
Populations of CD4+ and CD8 + T and NK cells in TC-1 and MC38 tumor tissues. Each group (n = 5/group) of mice was challenged s.c. with TC-1 and MC38 cells. When the tumor sizes became 8 mm, the mice were sacrificed, and the tumor tissues obtained. Immune cells (5,000 CD45-positive cells) of the tumor tissues were analyzed for the CD3+/CD8 + T cell, CD3+/CD4 + T cell, and CD3-/CD49b+ NK cell populations. *p < .05 compared with TC-1