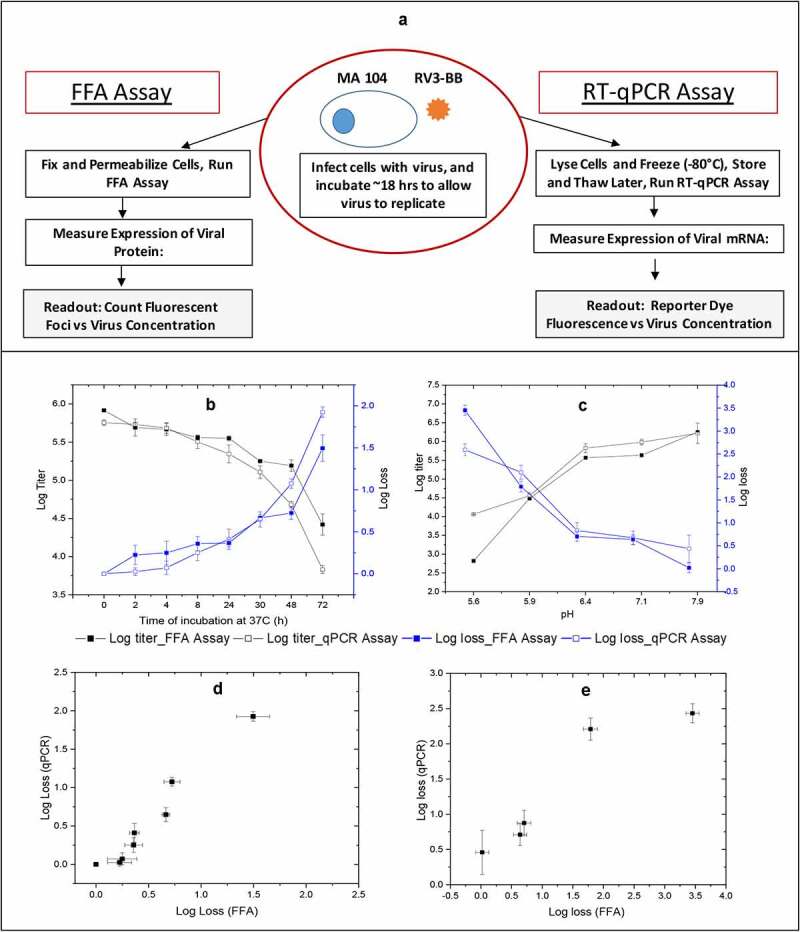
Figure 1.

Outline of the FFA and RT-qPCR in vitro potency assays and correlations of RV3-BB stability results as measured by both assays. Panel (a) shows outline of the in vitro potency assays for determining RV3-BB log titers. The infectious titer (Log FFU/ml) and titer loss (log loss vs. unstressed control) values were measured by RT-qPCR assay and FFA after RV3-BB virus (in DMEM medium) was subjected to (b) Thermal stress at 37°C for up to 72 h, and (c) pH stress at 5.5 to 8.0 at 37°C for 2 h with 20 mM citrate phosphate buffer. Panels (d) and (e) display correlation plots of RV3-BB stability as measured by both in vitro potency assays for the thermally-stressed and pH-stressed virus samples, respectively. Data are presented as the mean ± SD (n = 3)
