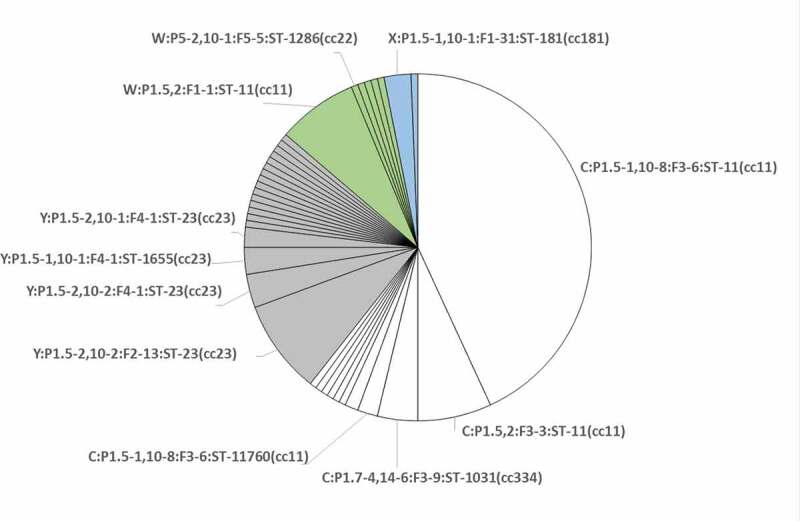
Figure 2.

Distribution of genotypes identified within the 162 isolates characterized for this study. Each slice corresponds to a genotype. The 11 genotypes, characterizing the 20 isolates selected for this study, are shown. Serogroups are differentiated by color: white for MenC; gray for MenY; green for MenW; light blue for MenX
