
Figure 1. Cryo-EM reconstruction and filament model of the P. aeruginosa T4P.
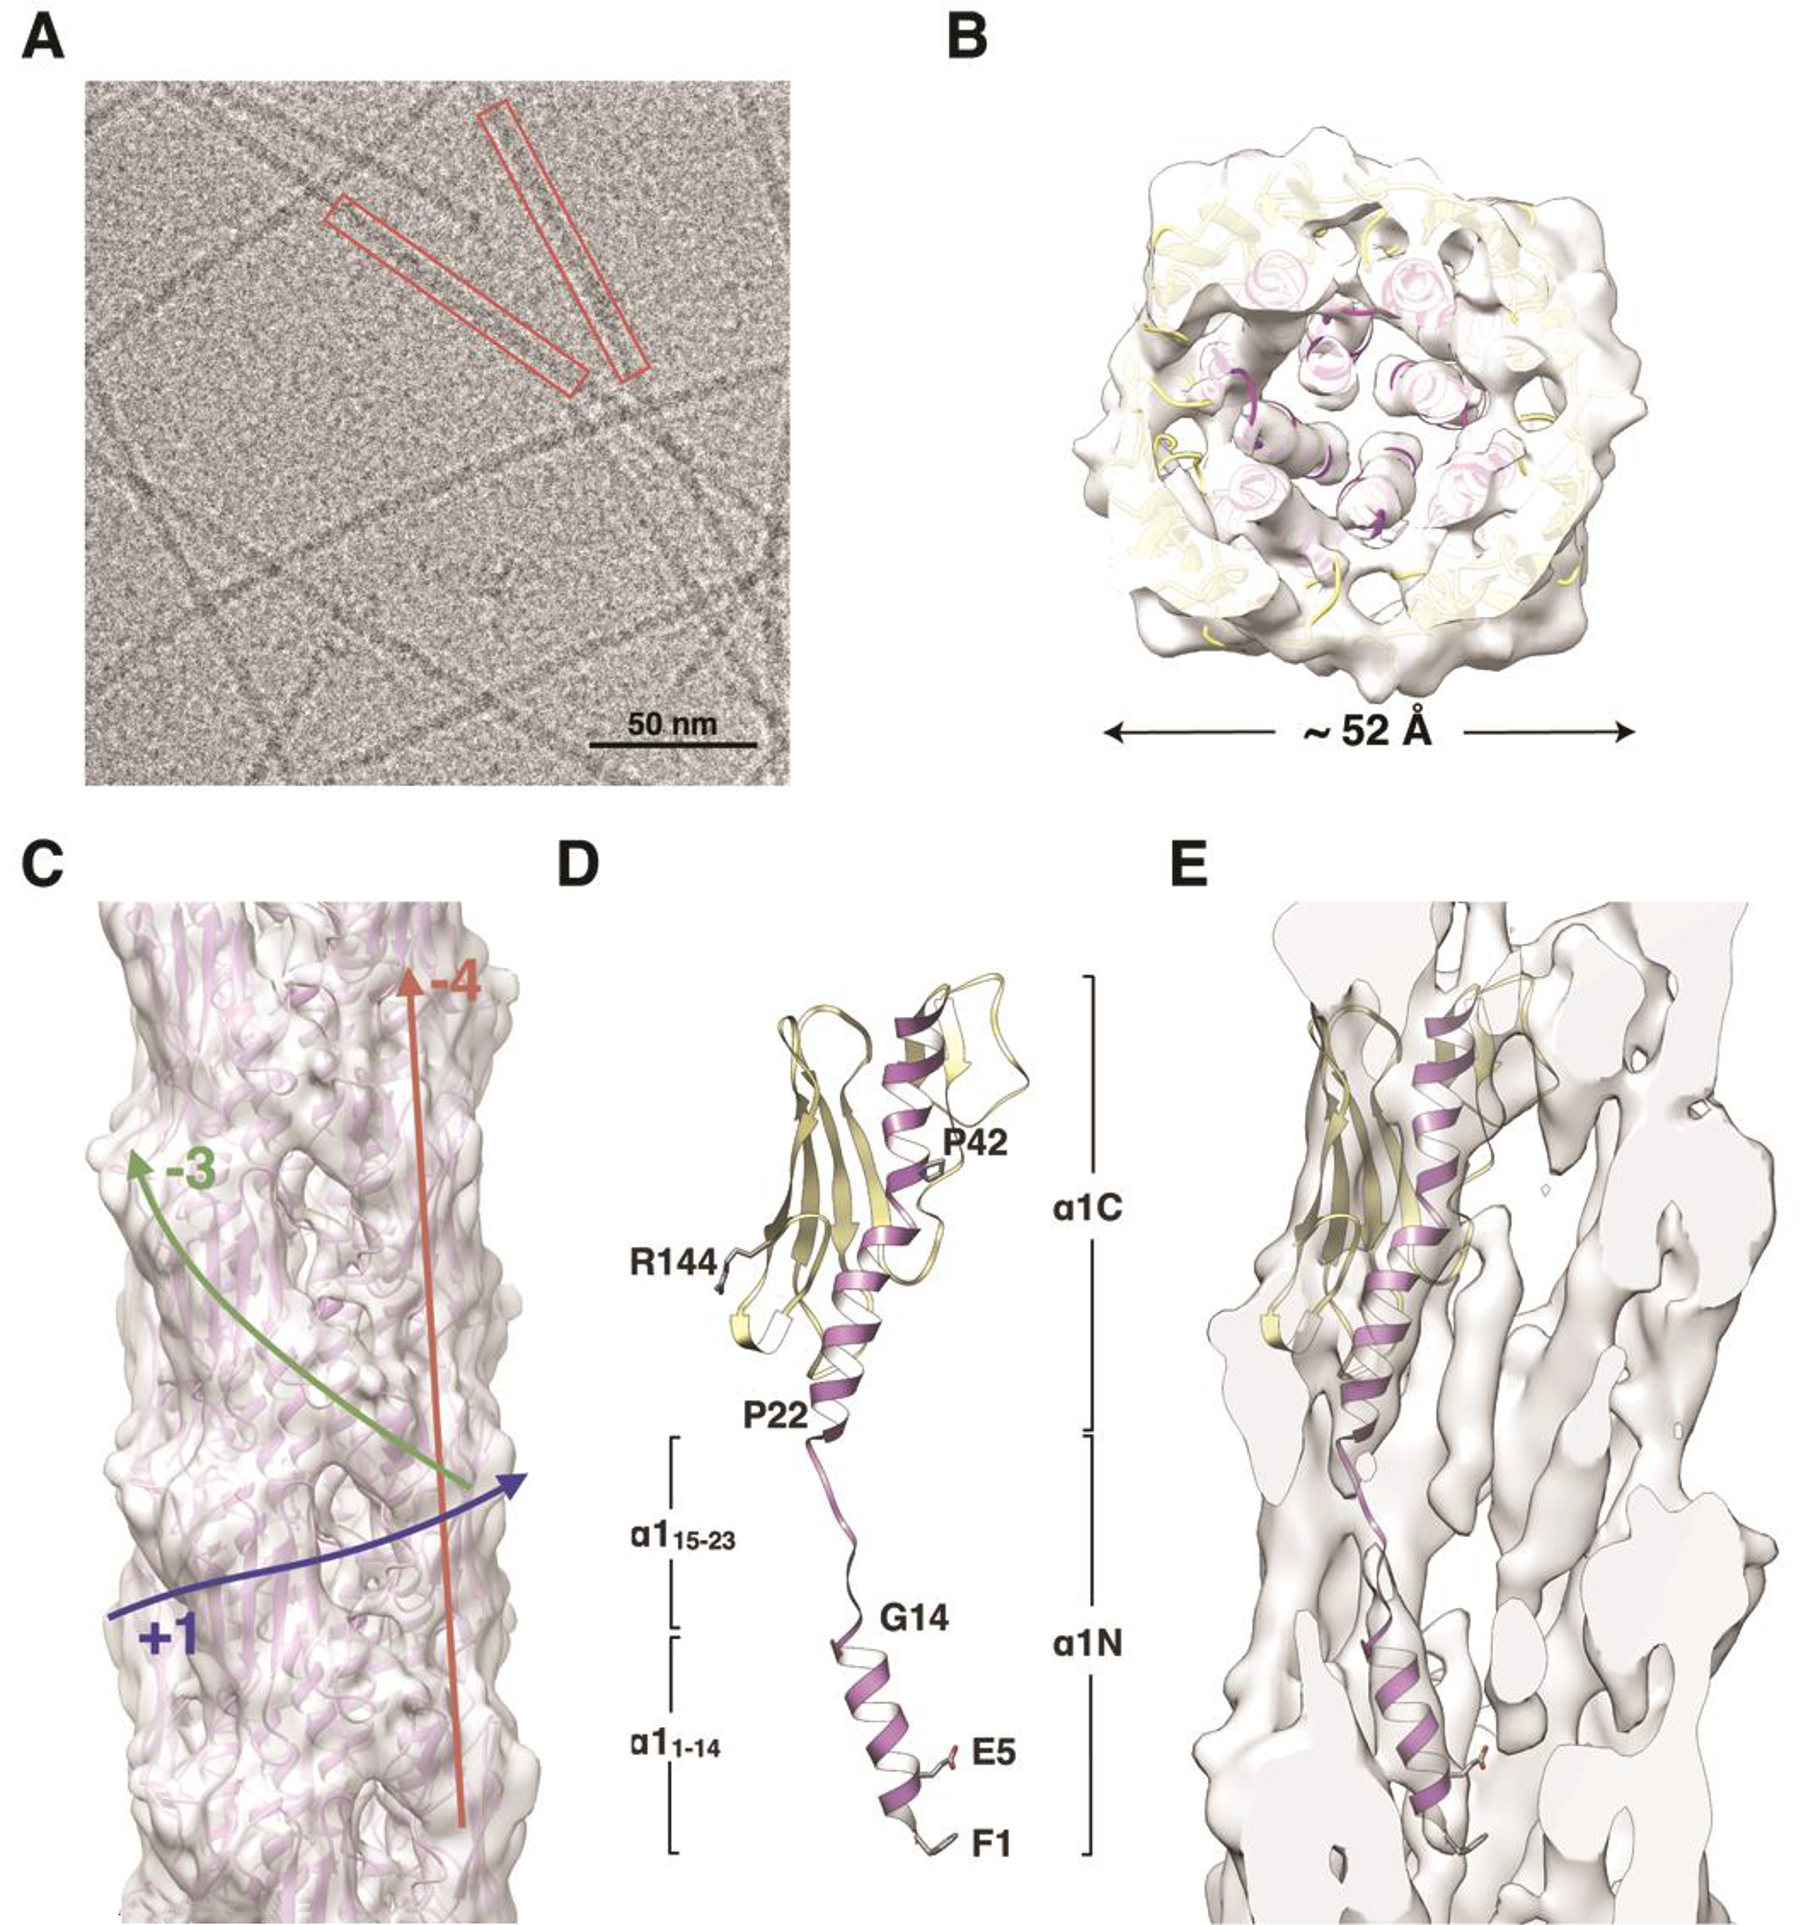
(A) Cryo-electron micrograph of P. aeruginosa T4P. (B) Slice of the PaK pilus reconstruction and filament model viewed along the filament axis. (C) Side view of the PaK pilus reconstruction and filament model. Colored arrows indicate the paths of the (+)1-, (−)3- and (−)4-start helices. (D) Ribbon representation of the PilA subunit model generated by fitting the protein into the cryo-EM density in three segments: the globular domain and α1:1–14 were fit separately as rigid bodies from the PilA crystal structure 1OQW, and α1:15–23 was modeled in an extended conformation. α1 is purple and the remainder of the globular domain is yellow. This subunit model was used to generate the PaK pilus filament model. (E) Slice through the cryo-EM density map showing a single PilA subunit. See also Figure S1A, Movie S1.