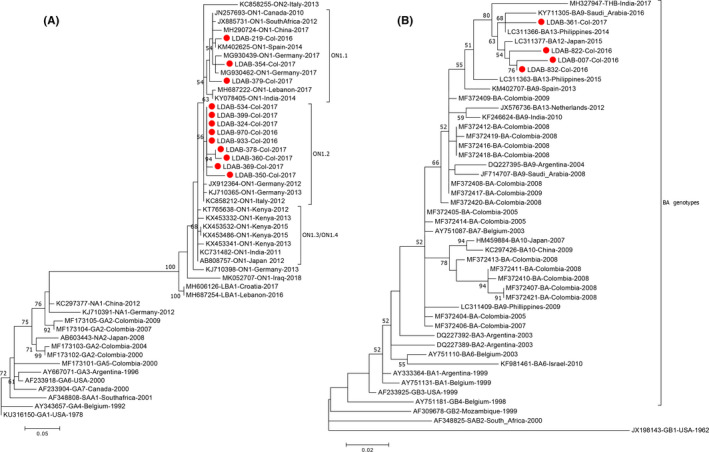
FIGURE 4.

Clustering of RSV‐A and RSV‐B specimens from Cali. (A) Phylogenetic grouping of the hypervariable region of RSV‐A compared to reference sequences of ancient and novel RSV‐A genotypes, plus an extended view of ON lineage. (B) Phylogenetic reconstruction of hypervariable region of RSV‐B, showing clusters of BA genotypes. Sequences coming from this work are indicated with red dots. Both phylogenies were constructed in MEGA7 using the maximum likelihood method based on the general time reversible model and considering all nucleotides as informative; the unit for branch lengths is number of nucleotide substitutions per site 30
