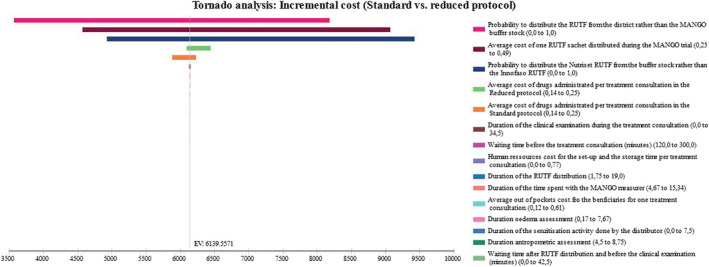
FIGURE 2.

Univariate sensitivity analysis: Tornado diagram of global incremental cost between arms. The horizontal axis is our main outcome (the cost reduction between the compared protocols); along the vertical axis, parameters are arrayed, and horizontal bars represent the outcome range associated with each specified parameter's tested range in the sensitivity analysis. The outcome point estimate corresponding to base case values is indicated by the vertical line cutting through all horizontal bars. The two most influential variables on the difference between the two arms were the provenance of RUTF then followed by the average cost of drug administrated during a treatment consultation. Other variables had limited impact on incremental cost between the two dosages. RUTF: ready‐to‐use therapeutic food
