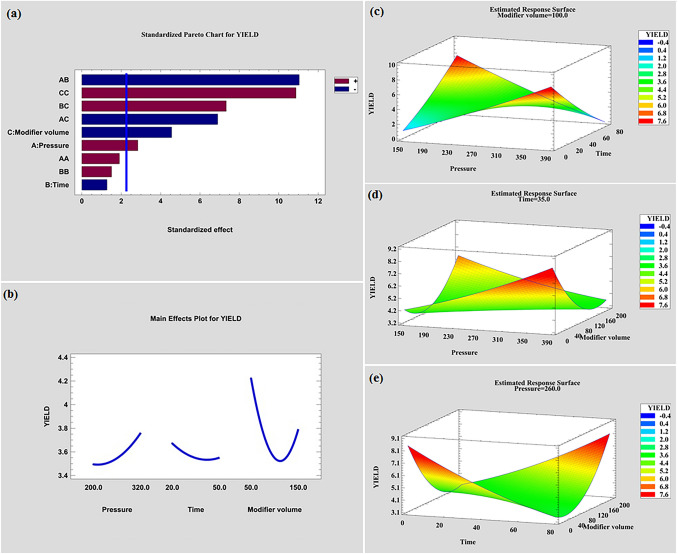
Fig. 4.
a Standardized Pareto chart in the central composite design, b main effect plots of pressure, modifier volume and dynamic extraction time, c response surfaces using the central composite design obtained by plotting pressure (atm.) versus dynamic extraction time at 100 μL of modifier volume, b pressure (atm.) versus modifier volume (µl) at 35 min of dynamic extraction time and d dynamic extraction time (min) versus modifier volume (µl) at 260 atm

