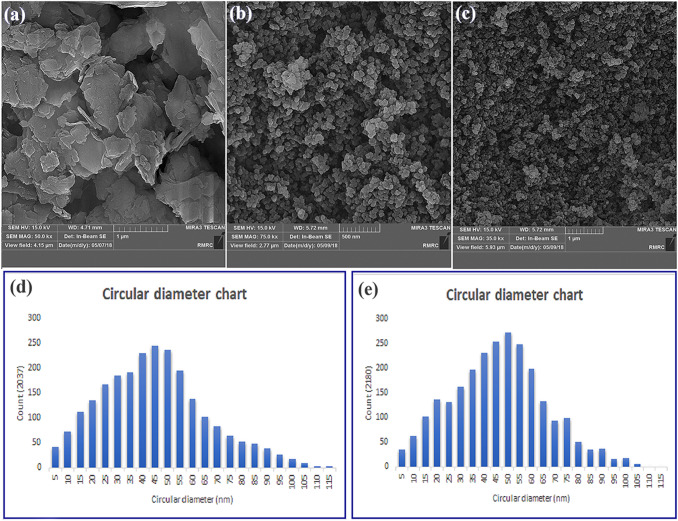
Fig. 6.
FESEM images of precipitated extract particles under different conditions. a Crystalline particles produced during experiment 7 (size bar > 500 nm), b nanoparticles produced during experiment 9, c nanoparticles produced during experiment 10, d the particle size distribution diagrams correspond to experiment 9 (size bar < 120 nm, Count: 2037) and e the particle size distribution diagrams correspond to experiment 10 (size bar < 120 nm, count: 2180)

