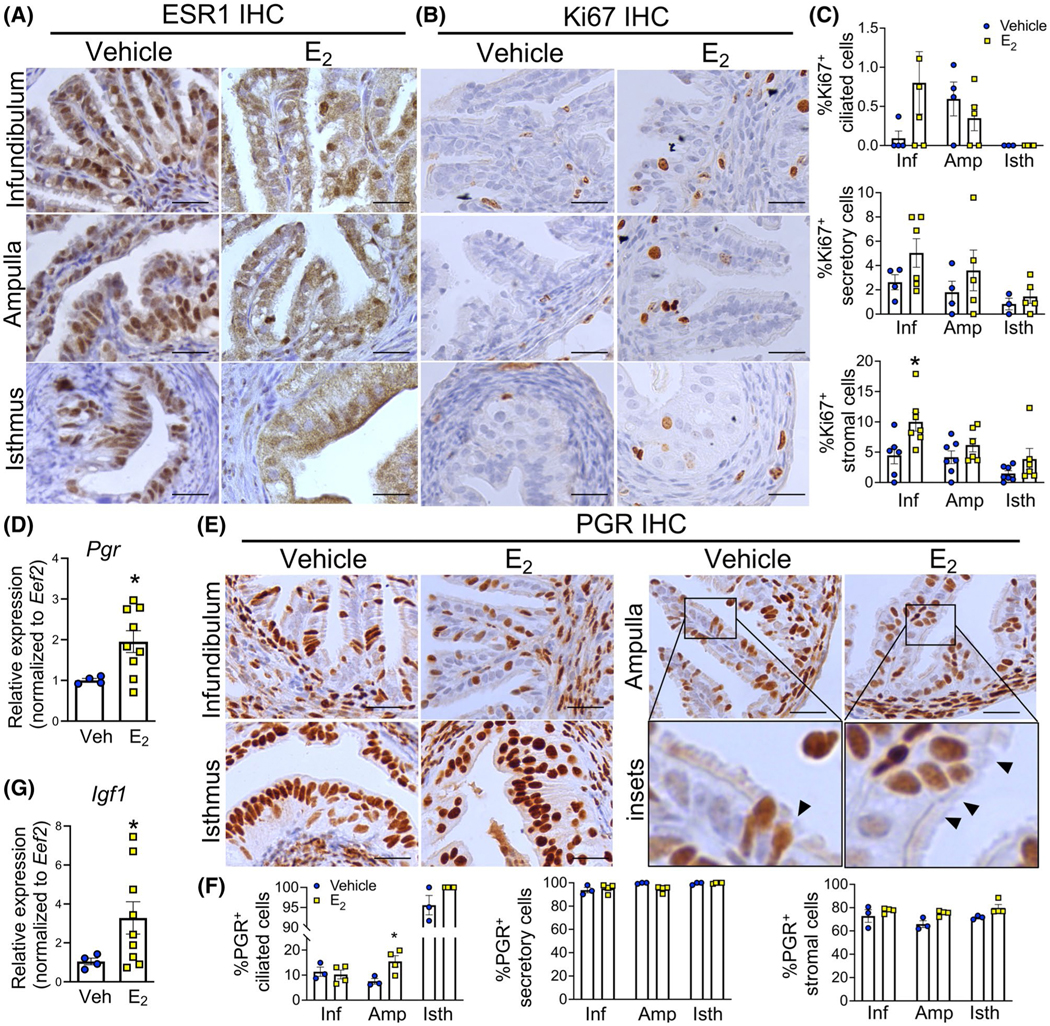
FIGURE 1.

Ki67-positive cells and PGR expression in the mouse oviduct after E2 treatment. A-B, Immunohistochemical (IHC) analyses of ESR1 and Ki67 expression of the infundibulum, ampulla, and the isthmus of the oviduct, respectively. Oviducts were collected from ovariectomized mice after 24 h of treatment with Veh or E2 (0.25 μg/mouse), n = 3–4 mice/group. C, Quantification of Ki67-positive ciliated, secretory and stromal cells. D, Transcript levels of Pgr in the whole oviduct after 24 h of Veh or E2 treatment (n = 4–9 mice/group). E. IHC analysis of PGR expression at the infundibulum, the ampulla and the isthmus after 24 h of treatment with Veh or E2. Insets are enlarged images of area with PGR+ ciliated cells (arrowheads) in the ampulla. F. Quantification of PGR-positive ciliated, secretory and stromal cells. G. Transcript levels of Igf1 in the whole oviduct after 24 h of Veh or E2 treatment (n = 4–9 mice/group). Scale bars = 25 μm. Each dot represents data from each mouse. *P < .05, significantly different when compared to the corresponding Veh, unpaired Student’s t-test with Welch’s correction
