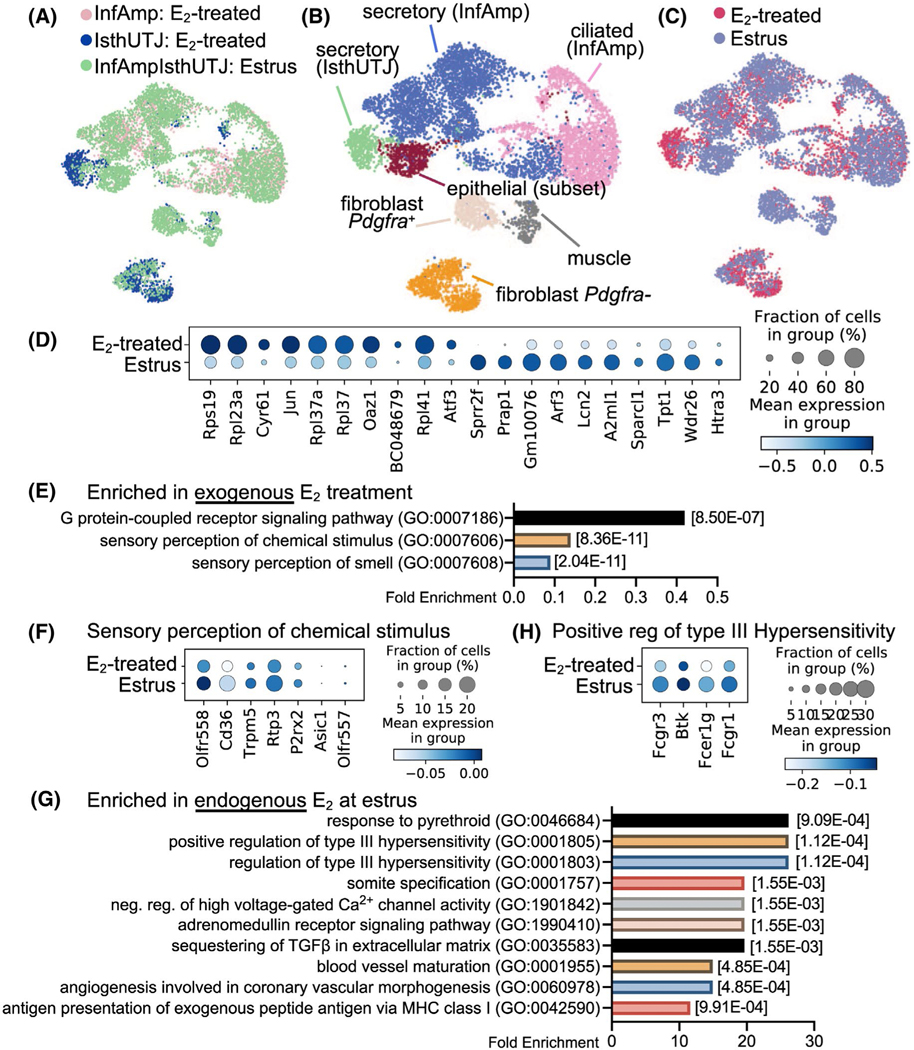
FIGURE 3.
Exogenous and endogenous E2 induce differential transcriptional signatures in the oviduct. Endogenous E2 single cell samples were collected from the entire oviduct at the estrus stage (n = 5 mice). scRNA-seq data from estrus (endogenous E2) were combined with data from ovariectomized E2-treated samples (exogenous E2) shown in Figure 2 for comparison analyses. A, Estrus and E2-treated (InfAmp and IsthUTJ) datasets were overlapped. B, After the dataset from E2-treated and estrus samples were combined, scRNA-seq data were analyzed and separated into 7 cell clusters containing the similar cell populations to that in Figure 2. C, Overall similarity and difference between endogenous vs. exogenous E2 in the oviductal cells. D, Dot plot of top 10 differentially expressed genes between exogenous and endogenous E2 in the oviduct. E, Top biological processes using gene ontology analysis of gene enrichment in exogenous E2 treatment. F, Dot plots of genes enriched in sensory perception of chemical stimulus in exogenous E2 treatment. G, Top biological processes of genes enriched in estrus samples. H, Dot plots of genes enriched in positive regulation of type III hypersensitivity in estrus samples

