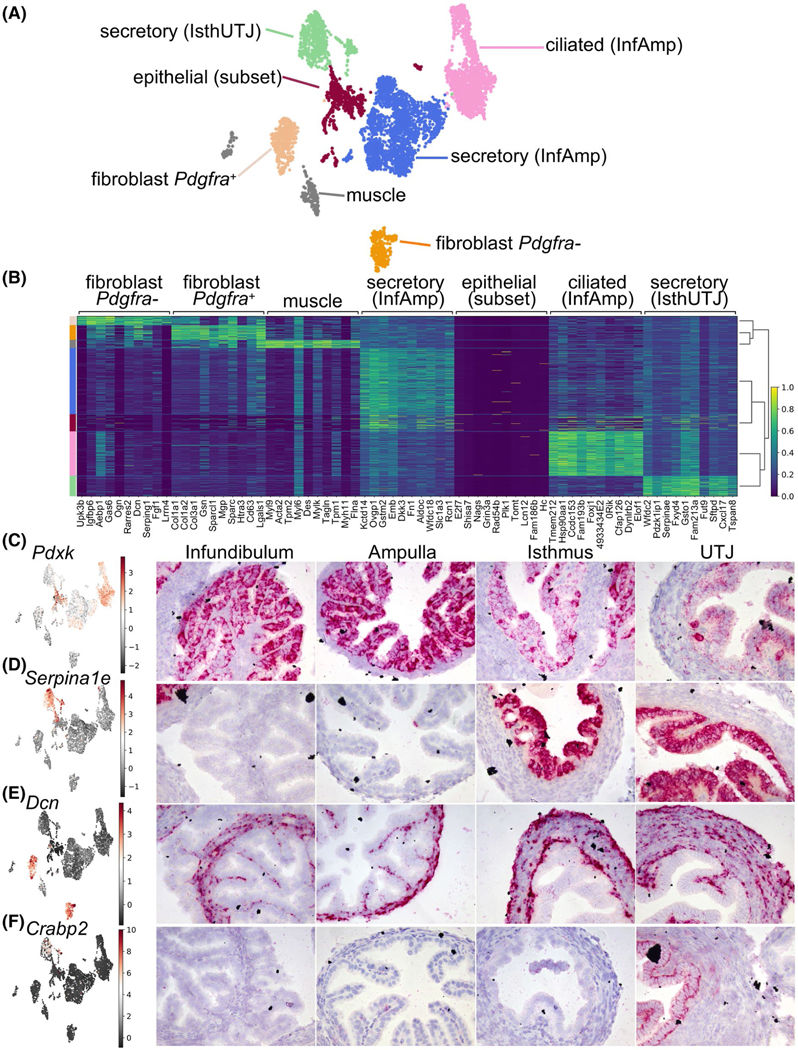
FIGURE 4.

Cells isolated from estrus alone show similarity of cell clusters identified in the E2-treated dataset. A, UMAP plot of scRNA-seq analysis from estrus samples. Cells were separated into 7 cell clusters. B, Heatmap plot of top ten differentially expressed genes in each cell cluster. Color-coded bar on the left is coordinated with the cell clusters in A. In situ hybridization analyses of (C) Pdxk, (D) Serpina1e, (E) Dcn, and (F) Crabp2 transcripts in the oviduct from samples collected randomly at different stages of the estrous cycle from ovarian intact adult female mice
