FIGURE 5.
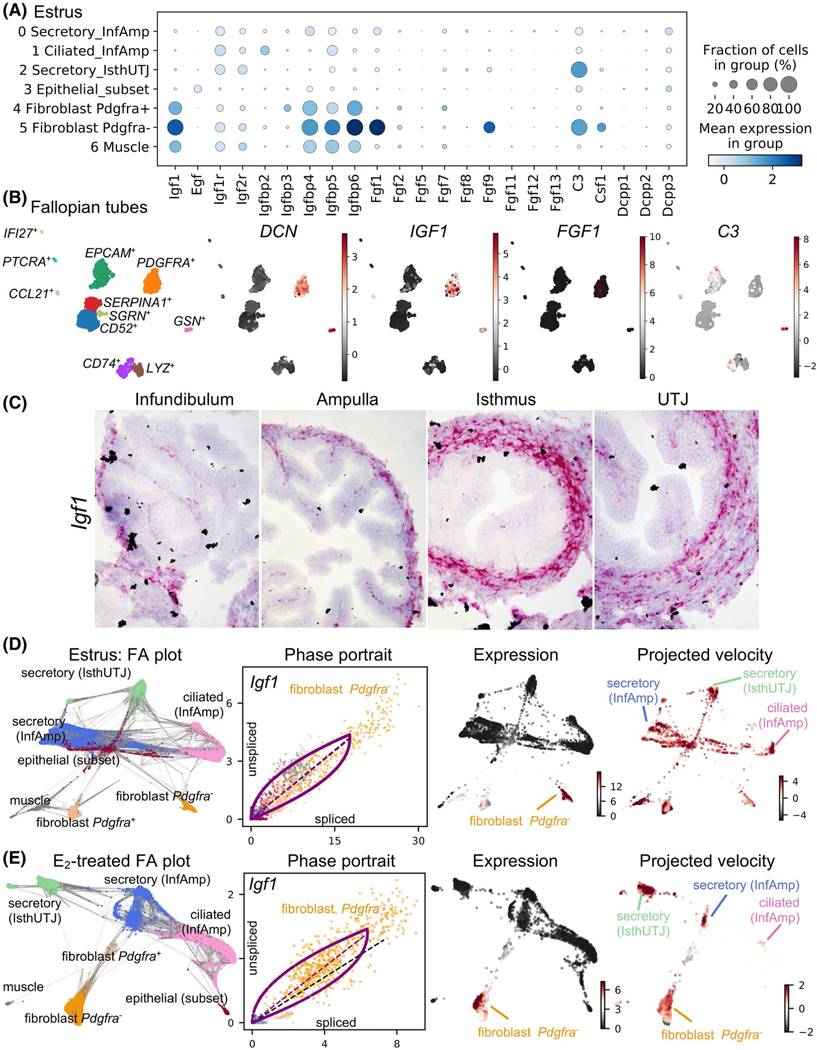
Unique cell populations in mouse oviducts and human Fallopian tube produce embryotrophic factor(s). A, Dot plot of embryotrophic factors and associated proteins in each cell cluster in the mouse oviduct collected at estrus. Insulin-like growth factor 1 (Igf1), epidermal growth factor (Egf), IGF receptor (Igfr), IGF-binding protein (Igfbp), fibroblast growth factor (Fgf), compliment C3 (C3), colony-stimulating factor 1 (Csf1), and demilune cell parotid proteins 1–3 (Dcpp). Different sizes of the circle represent percentages of the cells with expression of each gene. Color scale represents normalized expression value. B, scRNA-seq analysis of cell clusters from human Fallopian tube isolated from one individual as a proof-of-concept. Marker genes for each cell cluster are indicated in Figure S6. Stromal cells (decorin, DCN+) also express IGF1, FGF1, and C3. C, Expression of Igf1 in the mouse oviduct using ISH analysis. D and E, ForceAtlas2 (FA) plot, phase contrast, expression, and RNA project velocities of Igf1 from mouse oviductal cells at (D) estrus or (E) after E2 treatment. Gray lines in the FA plot represent all velocity-inferred cell-to-cell connections/transitions but do not differentiate the directionality of velocity. Phase portraits depict a spliced vs. unspliced Igf1 mRNA. Black dotted line represents constant transcriptional state. The expression of Igf1 is mainly in the fibroblast cell populations, but the inferred direction of RNA velocity (projected velocity) showed the trajectory towards ciliated (InfAmp), secretory (InfAmp), and secretory (IsthUTJ) cell populations

