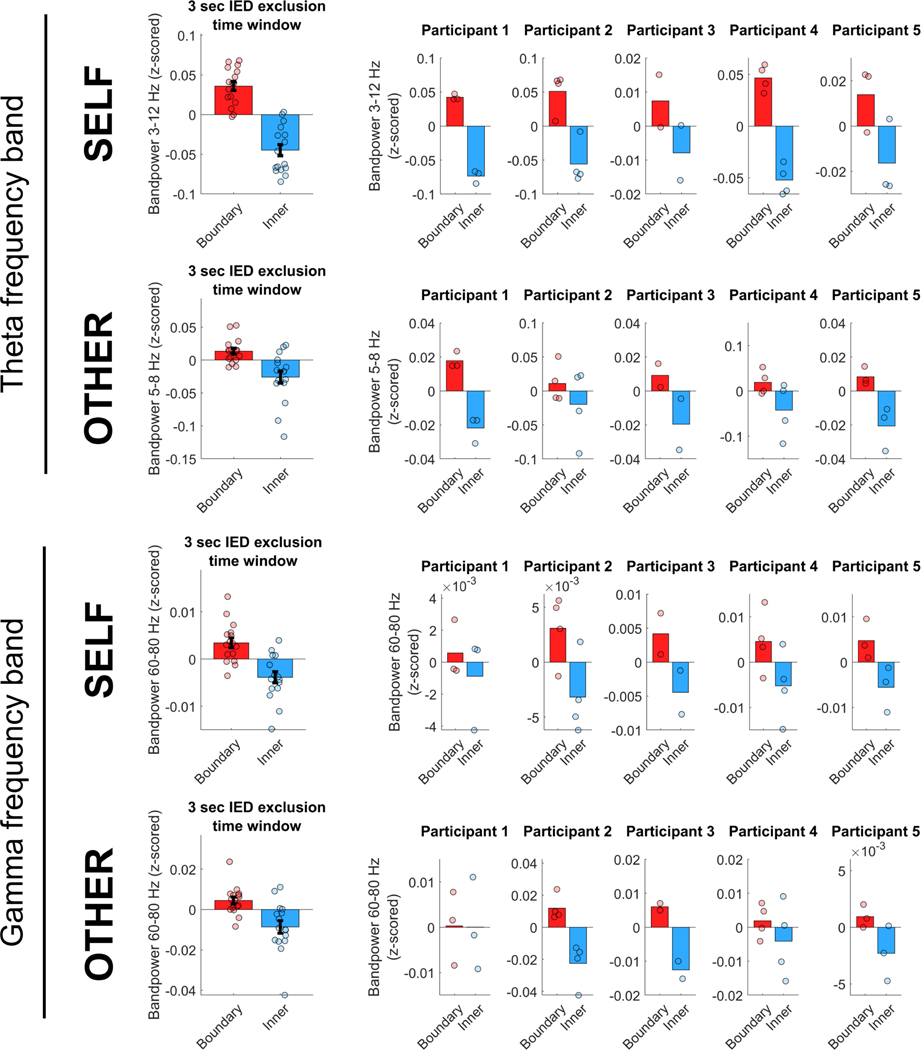
Extended Data Fig. 8 |. Main effects after exclusion of an extended 3-s time window around epileptic events.
Control analysis confirming the main effects of increased theta (top two rows) and gamma (bottom two rows) bandpower near boundaries, as compared with the inner area of the room, during both self-navigation (self) and observation (other), after excluding data within a time window of 3 s around each epileptic event (1.5 s before and after each detected IED sample, respectively). Data in the left panel show means ± s.e.m. from nCh = 16. Data in the right panels show mean values across channels per participant (participants 1 and 5, nCh = 3; participants 2 and 4, nCh = 4; participant 3, nCh = 2).

