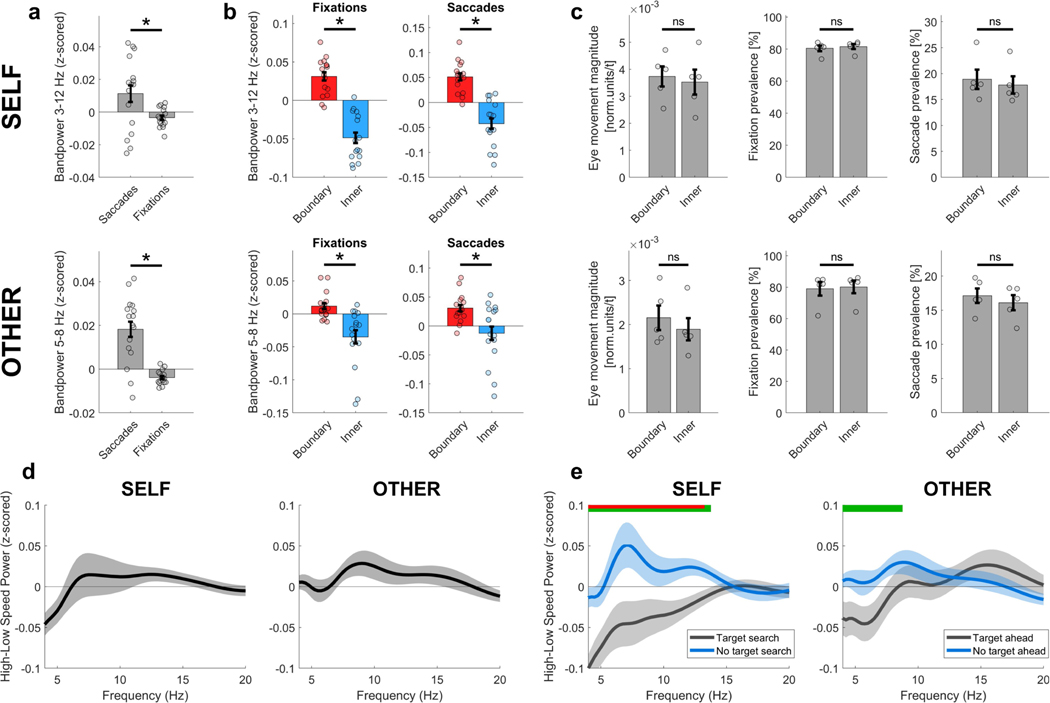
Extended Data Fig. 4 |. Impact of eye movements, and relationship between movement speed and theta power.
a, Participants’ eye movements were quantified throughout the experiment by measuring the pupil position on a normalized two-dimensional recording plane. Epochs of saccades and fixations were classified through algorithms based on a k-means cluster analysis39. Reported data for fixations and saccades indicate their prevalence over time (percentage of time throughout all task blocks). Theta power was higher during saccadic compared with fixation periods, for both self-navigation (P = 0.029) and observation (P < 0.001). b, Theta power was increased significantly near boundaries during both saccadic and fixation periods, for both self-navigation (saccades, P < 0.001; fixations, P < 0.001) and observation (saccades, P = 0.007; fixations, P = 0.002). c, The magnitude of eye movements (in normalized units per time point), fixation prevalence and saccade prevalence were not significantly different between ‘boundary’ and ‘inner’ room areas, neither during self-navigation (eye movement magnitude, P = 0.190; fixations, P = 0.189; saccades, P = 0.191) nor during observation (eye movement magnitude, P = 0.183; fixations, P = 0.372; saccades, P = 0.502). d, Theta power during epochs of high movement speed and low movement speed, based on a median split of movement speed values across all data from the self-navigation (self) or observation (other) tasks. Plots show the average power during movements with low speed (below median) subtracted from high speed (above median); thus, positive values indicate higher power for fast compared with slow movements. High–low speed power was not significantly different after multiple comparisons correction (FDR44,45) for any of the tested frequencies, in a one-sided permutation test for nCh = 16 (all P > 0.05, uncorrected). e, Theta power during epochs of high movement speed versus low movement speed, separately for ‘target search’ versus ‘no target search’ periods during self-navigation, and for ‘target ahead’ versus ‘no target ahead’ periods during the observation task. Green horizontal bars indicate significant high–low speed power differences (uncorrected) between ‘target search’ versus ‘no target search’ periods (self) or ‘target ahead’ versus ‘no target ahead’ (other) periods, and the inset red bars indicate significance after multiple comparisons correction (FDR44,45), in a one-sided permutation test for nCh = 16. The power difference between ‘target search/ahead’ and ‘no target search/ ahead’ was not significantly different between self-navigation and observation ([NoTargetSearchself – TargetSearchself] versus [NoTargetAheadother – TargetAheadother]; P > 0.05 for all frequencies; P < 0.1 for frequencies between 7 Hz and 14 Hz; FDR-corrected44,45; one-sided permutation test for each frequency in steps of 1 Hz; nCh = 16). Data in all plots show means ± s.e.m. from nCh = 16 (a, b, d, e) or n = 5 participants (c). Asterisks denote a significant difference (P < 0.05, uncorrected) in a one-sided permutation test; ns, non-significant. Analyses and plots of bandpower differences were corrected for differences in data amount between conditions (see Methods).

