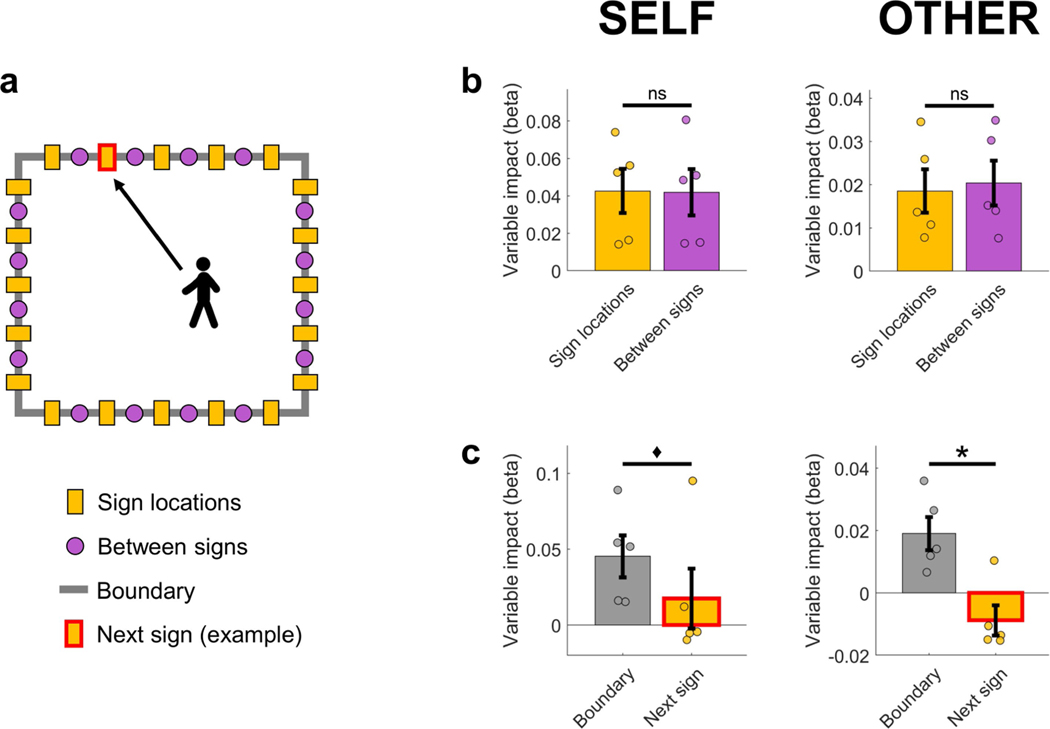
Extended Data Fig. 5 |. Impact of wall-mounted signs on theta power.
Linear mixed-effect models were used to quantify the impact of wall-mounted signs and proximity to the boundary on theta power during self-navigation (self) and observation (other). The theta frequency range was identical to the main ‘boundary’ versus ‘inner’ analyses (self, 3–12 Hz; other, 5–8 Hz). a, Diagram of the room from the top-down perspective, with yellow rectangles indicating wall-mounted signs (which provided strong visual cues for the participants), purple dots indicating locations in between signs (which did not correspond to visible landmarks but were defined for post hoc analysis only), and the grey rectangle indicating the room boundary. The red rectangle frame indicates the next wall-mounted sign that the participant (during self-navigation) or the experimenter (during observation) was walking towards (shown here is one example; the specific sign changed between trials). b, Comparison between the impact of proximity to sign locations versus proximity to locations in between signs. The impact of proximity to sign locations on theta power was not significantly different from the impact of locations in between signs, either during self-navigation (self, P = 0.815) or during observation (other, P = 0.176). c, Comparison between the impact of proximity to boundary versus the next wall-mounted sign that the participant or experimenter was walking towards. The impact of proximity to boundary was numerically higher in both conditions, but the difference between the variables’ impact was statistically significant only during observation (other, P = 0.028) and not during self-navigation (self, P = 0.059). Note that periods of walking towards the next wall-mounted sign during self-navigation are equivalent to ‘no target search’ periods, and that the proximity of the experimenter to the next wall-mounted sign during the observation task is generally highest during ‘no target ahead’ periods. This explains the low or negative relationship between theta power and proximity to the next wall sign, as theta power is generally decreased and there is no significant effect of boundaries on theta power during these periods (Fig. 4). The difference between the impact of ‘boundary’ and ‘next sign’ was not significantly different between self-navigation and observation ([Boundaryself – NextSignself] versus [Boundaryother – NextSignother], P = 0.493). Data in all plots (b, c) show mean beta values ± s.e.m. from n = 5 participants. The asterisk denotes a significant difference (P < 0.05, uncorrected) in a one-sided permutation test; the diamond denotes P < 0.1 (non-significant); ns, P > 0.1 (non-significant).

