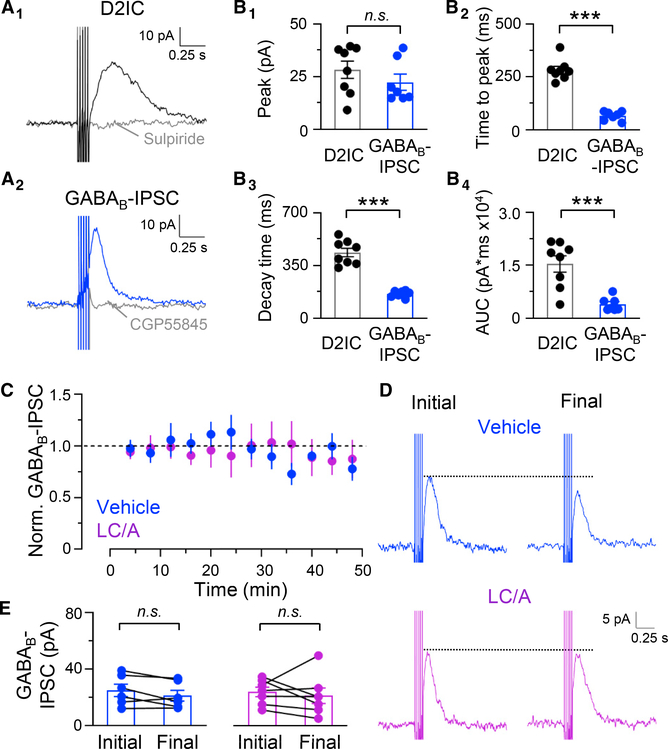
Figure 6. Distinct kinetics of D2ICs versus GABAB IPSCs in SNc DA neurons and lack of effect of LC/A on evoked GABAB IPSCs.
(A) Evoked D2ICs and GABAB IPSCs recorded in separate DA neurons. Sulpiride (1 μM) abolished evoked D2ICs (A1) and CGP55845 (300 nM), a GABAB receptor antagonist, abolished GABAB IPSCs (A2).
(B) Kinetics of D2ICs and GABAB IPSCs. Comparison of peak amplitude (B1), time to peak (B2), decay time (B3), and area under the curve (AUC) (B4) for D2ICs (n = 8) and GABAB IPSCs (n = 7). Peak amplitude (D2IC, 28.3 ± 3.8 pA; GABAB IPSC, 22.3 ± 3.5 pA, p = 0.3), time to peak (D2ICs, 283 ± 16 ms; GABAB IPSCs, 66 ± 7 ms, ***p < 0.001), decay time constant (D2ICs, 436 ± 27 ms; GABAB IPSCs, 163 ± 9 ms, ***p < 0.001), AUC (pA*ms) (D2ICs, 15.4 ± 2.2 × 10³; GABAB IPSC, 3.9 ± 0.7 × 10³, ***p < 0.001). Bars are means ± SEM; unpaired t test.
(C) Time course of evoked GABAB IPSC amplitude, normalized to initial for each DA neuron with vehicle or LC/A in the pipette (vehicle, n = 6; LC/A, n = 7).
(D) Representative evoked GABAB IPSC recorded in voltage-clamp mode after establishing whole-cell recording (initial) and at the end of recording (final).
(E) Final GABAB IPSCs recorded with vehicle or LC/A (vehicle, 88% ± 9% of initial, n = 6, p = 0.12; LC/A, 86% ± 16%, n = 7, p = 0.5; paired t test).

