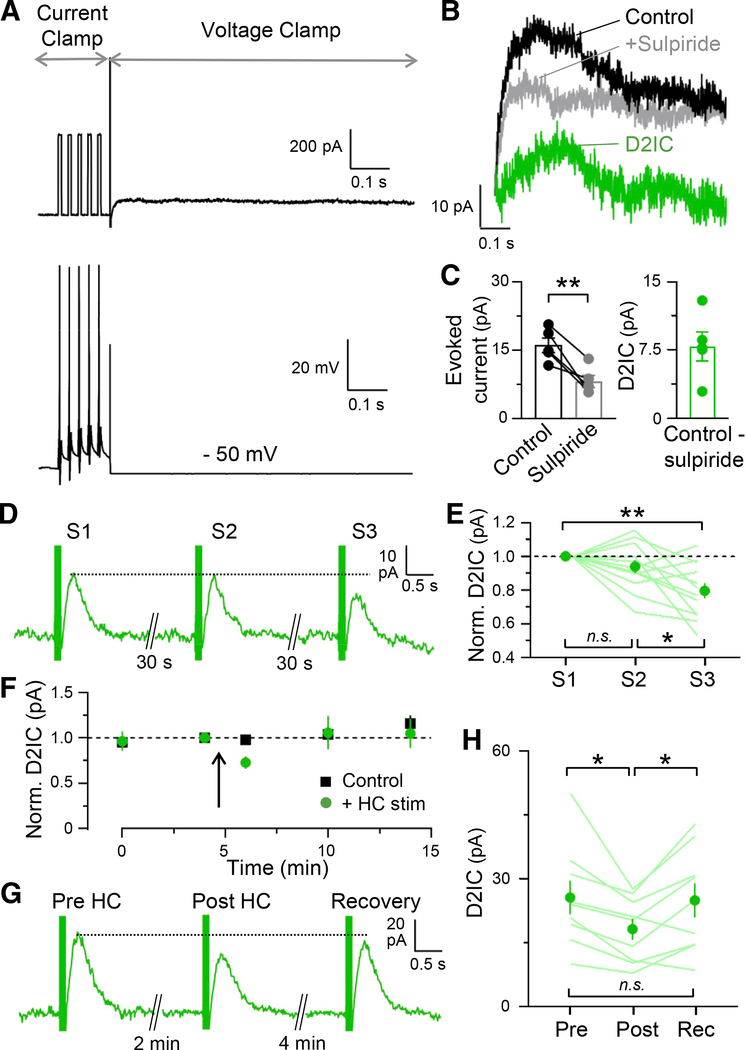
Figure 7. Evoked D2ICs in individual SNc DA neurons using HC.
(A) Schematic of HC protocol with current (top) and voltage traces (bottom). An SNc DA neuron was stimulated in current clamp by five current pulses (400 pA, 8-ms duration) at 40 Hz, followed by a switch to voltage clamp at −50 mV to record the resulting current.
(B) Averaged current responses of SNc DA neurons (n = 5) recorded when the holding potential was returned to −50 mV after current-clamp stimulation and before and after sulpiride (1 μM). The D2IC trace is the average of the difference between control and sulpiride for each SNc DA neuron.
(C) Evoked current before and after sulpiride (1 μM), with D2IC amplitude calculated as control minus sulpiride (control, 16.1 ± 1.4 pA; after sulpiride, 8.1 ± 1.2 pA, n = 5, **p < 0.01, paired t test; D2IC, 8.0 ± 1.4 pA).
(D) Use-dependent depression of evoked D2ICs with repeated local stimulation (5 pulse, 40 Hz). Three stimulations were delivered at 30-s intervals (S1–S3).
(E) Quantification of D2IC depression (40 Hz, 5 pulses) (S2, 94% ± 4% of S1; 3S, 80% ± 5% of S1, n = 12, **p < 0.01 S1 versus S3, *p < 0.05 S2 versus S3; one-way ANOVA, Tukey post hoc test).
(F) Amplitude of locally evoked D2ICs without (Control) and with preceding HC stimulation. After establishment of stable D2ICs at 4-min intervals, the HC stimulation protocol was initiated (arrow): 40 Hz, 5 pulses (400 pA, 8 ms duration) applied three times at 30-s intervals, followed by a 4-min interval before local stimulation to assess recovery (Control, post HC time point, 98% ± 3% of pre, p = 0.9, n = 5, recovery time point, 113% ± 8% of pre, p = 0.4, n = 5; one-way ANOVA, Tukey post hoc test).
(G) D2ICs evoked by local stimulation at pre-HC, post-HC, and recovery.
(H) Amplitude of locally evoked D2ICs at pre-HC, post-HC, and recovery (post-HC, 72% ± 6% of pre, recovery HC, 102% ± 11% of pre, n = 9, *p < 0.05 for pre- versus post-HC, post versus recovery HC; one-way ANOVA, Tukey post hoc test).

