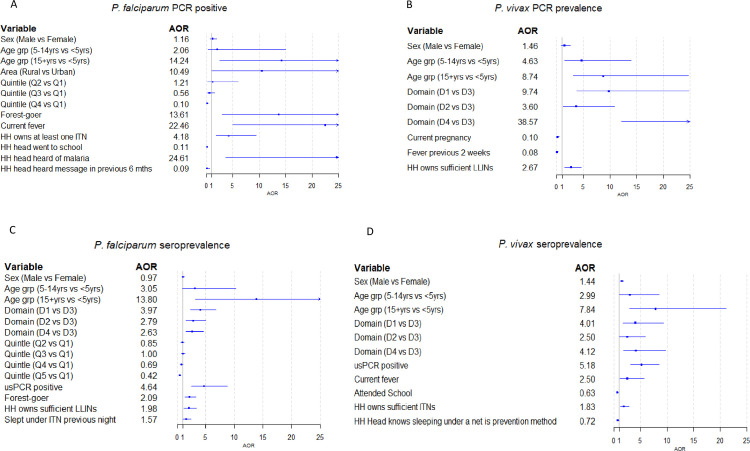
Fig 5. Forest plots showing Adjusted Odds Ratios (AOR) for risk factors related to being positive by usPCR or by serology across the whole study sample (n = 13,716 for PCR and 11,653 for serology).
A] Prevalence of P. falciparum, B] PCR prevalence of P. vivax, C] Seroprevalence of P. falciparum, D] Seroprevalence of P. vivax. Factors shown are those that remained significant in multivariate logistic regression analyses (plus sex and age group).

