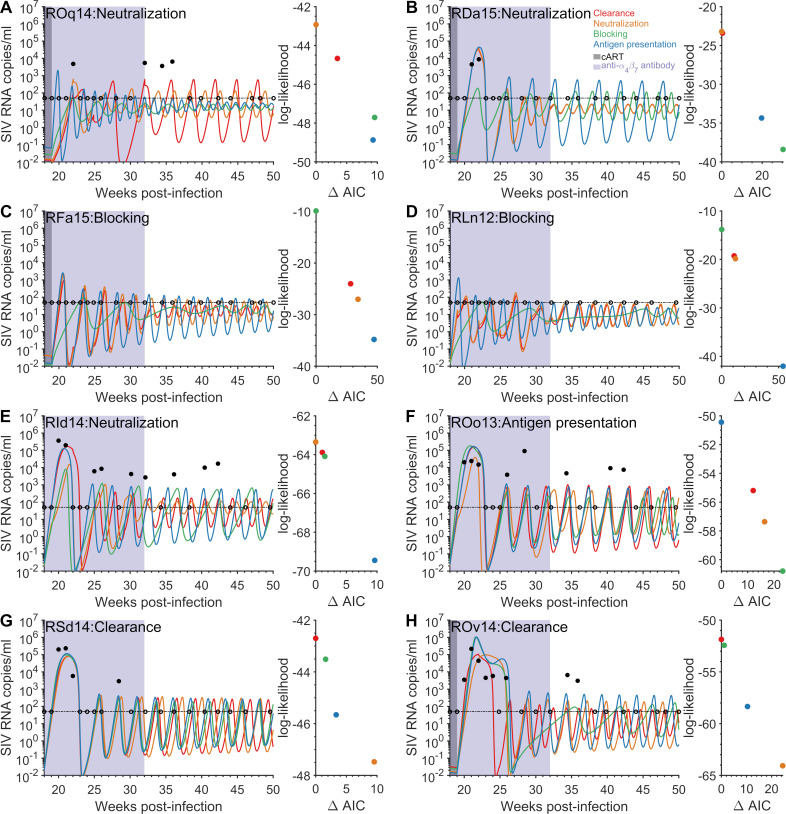
Fig 3. Viral dynamics after the removal of cART for the four anti-α4β7 antibody mechanisms of action.
The measured (≥50 SIV RNA copies/ml solid circles and <50 SIV RNA copies/ml open circles) and model predicted viral loads for the AIC selected model (indicated after macaque) and three remaining models using the best-fit parameter estimates for the mechanisms of increased viral clearance (red line), viral neutralization (orange line), target cell protection (green line), and increased antigen presentation (blue line), panels A)–H). For each macaque, a scatter plot of the ΔAIC and the log-likelihood for each mechanism, panels A)–H). The limit of detection is 50 SIV RNA copies/ml (thin horizontal dashed black line). Treatment with cART occurred between five weeks and 18/19 weeks post-infection (gray area), while eight infusions of the anti-α4β7antibody occurred between nine weeks post-infection and 32 weeks post-infection (purple area). The mechanisms considered include parameters for these simulations are in Tables 1 and S14–S18.

