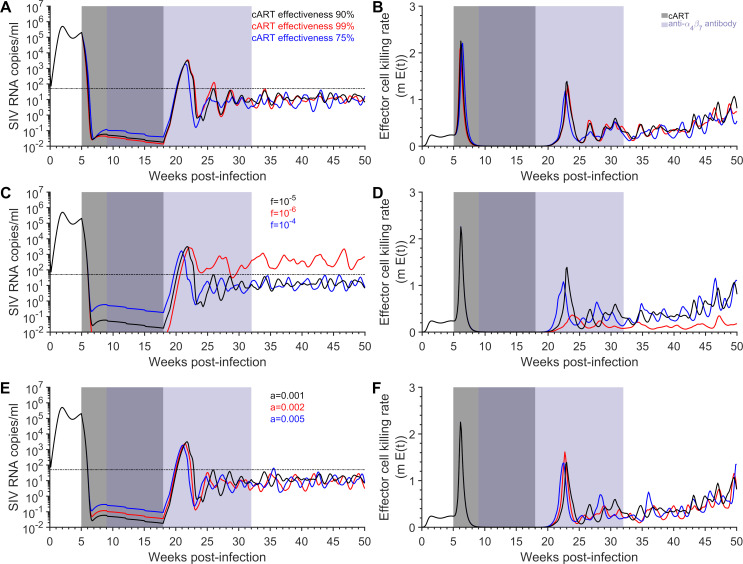
Fig 4. Sensitivity of the viral load dynamics and effector cell killing rate in the treated macaques predicted by the model.
The geometric mean of the model predicted viral load (left panels) and the per day effector cell killing rate (right panels) using the best-fit parameter estimates under the baseline source model with the greatest AIC weight for each of the treated macaques. The sensitivity of the viral load and per day effector cell killing rate with respect to changing the A)-B) effectiveness of cART from 90% (black) to 99%(red) and 75% (blue), C)-D) the fraction of infections resulting in latency from 10−5 (black) to 10−6 (red) and 10−4 (blue), and E)-F) the activation rate of latent cells from 10−3 (black) to 2 ×10⁻³ (red) and 5×10⁻³ (blue). The limit of detection is 50 SIV RNA copies/ml (thin dashed black line, left panels). Treatment with cART occurred between 5 weeks and 18/19 weeks p.i. (gray area), while eight infusions of the anti-α4β7antibody occurred between nine weeks p.i. and 32 weeks p.i. (purple area). Parameters for these simulations are in Table 1 and S14–S18 Tables, for the AIC selected mechanism (Table 2).

