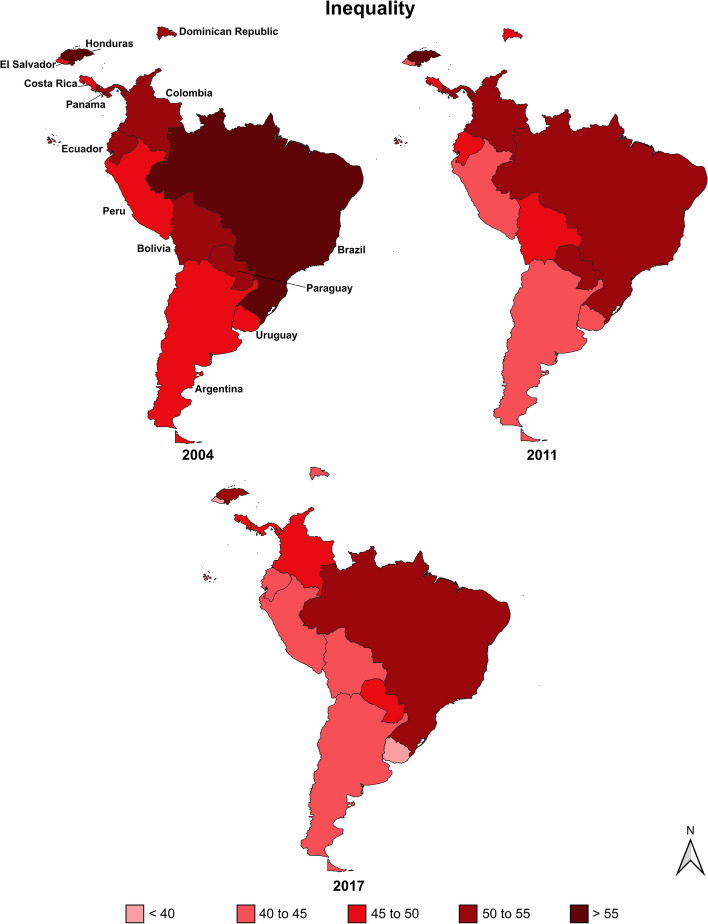
Fig. 2.
Inequality (Gini index) of all countries included in the sample in 2004, 2011, and 2017. Darker tones indicate regions with greater inequality. Data from the World Bank. To facilitate the visualization, all Latin America and Caribbean countries not included in our analysis were excluded from the figure. Shapefile from Archambault (2017)

