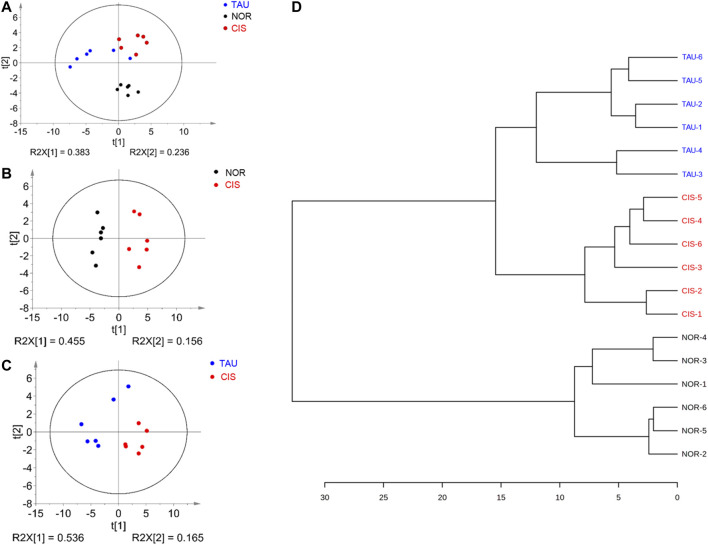
FIGURE 5.
Pattern recognition analysis for the 1D 1H NMR spectra recorded on aqueous extracts derived from the three groups of C2C12 myoblasts. (A) PCA score plot of the three groups of cells. (B, C) PCA score plots for CIS vs. NOR (B) and TAU vs. CIS (C). The ellipses indicate the 95% confidence limits. (D) Hierarchical cluster analysis for the three groups of cells.

