FIGURE 6.
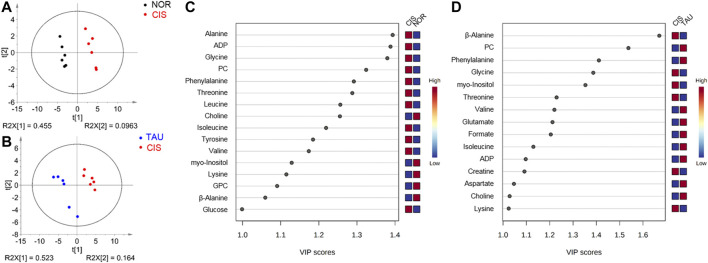
PLS-DA analysis for identifying significant metabolites primarily responsible for the discrimination of metabolic profiles among the NOR, CIS, and TAU groups of C2C12 myoblasts. (A, B) PLS-DA score plots for CIS vs. NOR (A) and TAU vs. CIS (B). The ellipses indicate the 95% confidence limits. (C, D) VIP score-ranking plots of significant metabolites identified from the PLS-DA models of CIS vs. NOR (C) and TAU vs. CIS (D). Significant metabolites were identified with VIP >1.

