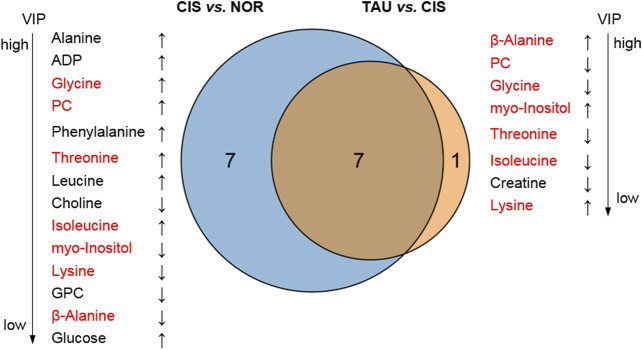
FIGURE 7.
Venn diagrams of characteristic metabolites identified from pairwise comparisons of CIS vs. NOR and TAU vs. CIS. Characteristic metabolites were determined by a combination of the significant metabolites identified from the PLS-DAs (VIP >1) and differential metabolites identified from the univariate analyses (p < 0.05). The upward arrow and downward arrow denote that the difference between A and B is positive (A is increased compared to (B)) and negative (A is decreased compared to (B)), respectively. The metabolites in red font refer to shared characteristic metabolites in the two comparisons.

