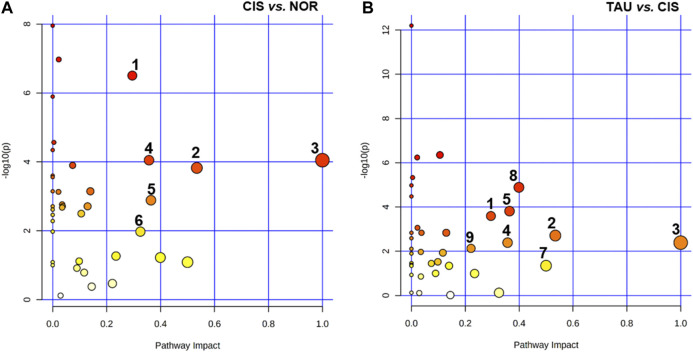
FIGURE 8.
Significantly altered metabolic pathways identified from pairwise comparisons of CIS vs. NOR and TAU vs. CIS. The significant pathways were identified with pathway impact values >0.2 and p values <0.05, using the Pathway Analysis module provided by MetaboAnalyst 4.0 webserver. Numbers in the panels represent significantly altered metabolic pathways: (1) glycine, serine, and threonine metabolism; (2) alanine, aspartate, and glutamate metabolism; (3) phenylalanine, tyrosine, and tryptophan biosynthesis; (4) phenylalanine metabolism; (5) glutathione metabolism; (6) starch and sucrose metabolism; (7) D-glutamine and D-glutamate metabolism; (8) β-alanine metabolism; and (9) histidine metabolism.

