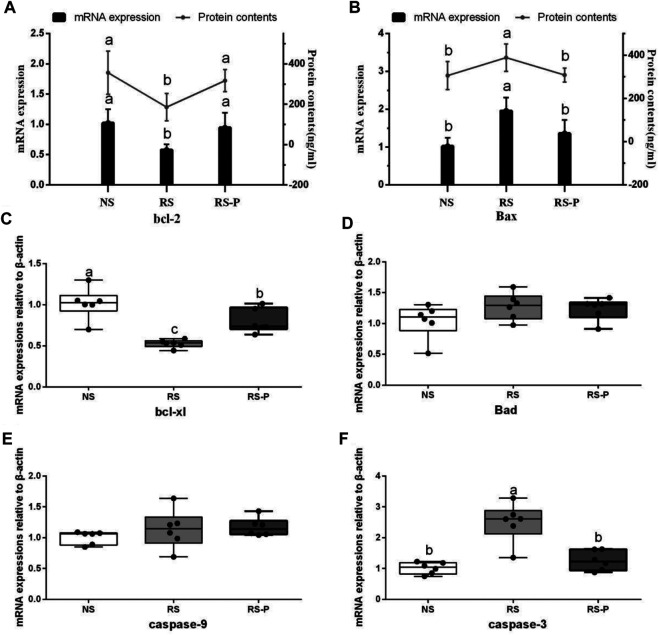
FIGURE 9.
Apoptosis-related functional protein contents and mRNA expression levels in the hippocampus. Data are presented with the means ± standard deviation (n = 6). Bars with different letters are significantly different on the basis of Duncan’s multiple range test (P < 0.05). (A)–(B): mRNA expression levels and protein contents of bcl-2 and Bax; (C)—(F): mRNA expression levels of bcl-xl, Bad, caspase-9 and caspase-3, respectively.

