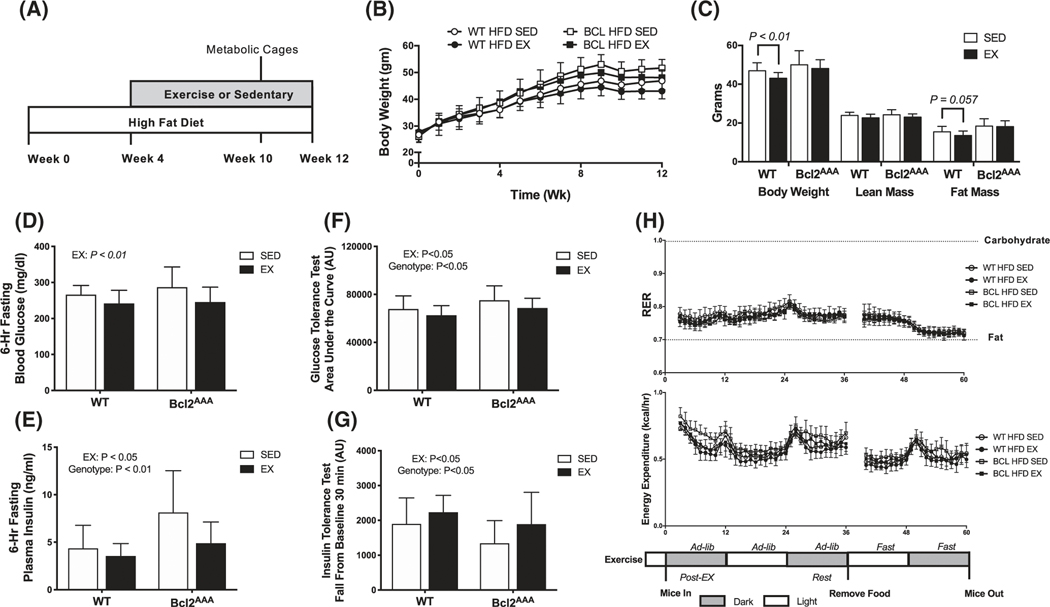
FIGURE 3.
Whole-body metabolic phenotype following high-fat feeding and exercise training. A, Wild-type and Bcl2AAA mice consumed a high-fat diet (HFD, 60% kcal from fat) for 4 wk then performed 8 wk of exercise training (EX) or remained sedentary (SED). During week 10, mice were individually housed in metabolic cages for 3 d. B, Body weight (grams) measured weekly. C, Body weight (grams) measured at 10 wk with lean and fat mass (grams), obtained from DEXA. D, Glucose concentrations (mg/dL) measured with a handheld glucometer in blood collected from a tail vein after a 6-h fast. E, Plasma insulin concentrations (ng/mL) measured with a commercial ELISA kit in blood collected from a tail vein after a 6-h fast. F, Area under the curve for a 2-h glucose tolerance test. Mice were fasted for 6 h then glucose was provided with an intraperitoneal injection of 2 g/kg body wt of a 20% dextrose solution. G, Fall from baseline in the first 30 min of a 2-h insulin tolerance test. Mice were fasted for 4 h then insulin injected intraperitoneally at 0.5 IU/kg body wt. H, Respiratory exchange ratio (RER; top) and energy expenditure (kcal/hr; bottom) calculated as 1-h averages from indirect calorimetry immediately post-exercise, in a rested state, and in a fasted state. Data are mean ± SD. Data in panel (C) were analyzed by Student’s t-test. Two-way ANOVA tested for effects of genotype and exercise in all other panels and P values are main effects. Group sizes are n = 12–17

