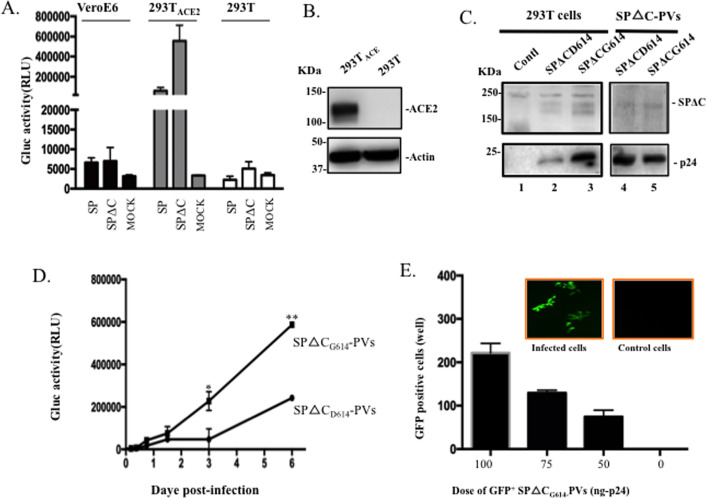
Fig 2. SARS-CoV-2 SP-PVs’s infection in different cell lines and SARS-CoV-2 SPG416 variant exhibited stronger virus entry.
A) 293TACE2, 293T, and Vero-E6 cells were infected by equal amounts of SARS-CoV-2SP- or SARS-CoV-2SPΔC-pseudotyped viruses (PVs), or mock-infected (MOCK). At 48 hrs pi, the Gluc activity in supernatants was measured. B) The expression of SARS-CoV-2SP receptor, ACE2 in 293T and 293TACE2 cells detected by WB with anti-ACE2 antibodies. C) Detection of SARS-CoV-2 SPΔC, SPΔCG614 and HIV p24 protein expressions in transfected 293T cells and viral particles by WB with corresponding antibodies. D) Infectivity comparison of SPΔC D614-PVs and SPΔCG614-PVs in 293TACE2 cells. Equal amounts of SPΔCD614-PVs and SPΔCG614-PVs virions (adjusted by p24 level) were used to infect 293TACE2 cells. At different days post-infection (pi), Gluc activity in supernatants was measured. The results are the mean ±SD of duplicate samples, and the data are representative of results obtained in two independent experiments. E) The SPΔCG614-GFP+PVs were produced from 293T cells and used to infect 293TACE2 cells in 96-well plate After 48 hrs pi, GFP-positive cells (per well) were counted and photographed by fluorescence microscope (on the top of the panel). Statistical significance was determined using unpaired t-test, and significant p values are represented with asterisks, *≤0.05, **≤0.01.

