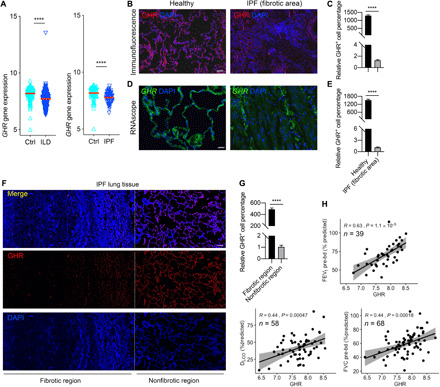
Fig. 1. Decreased expression of GHR in fibrotic human lungs.

(A) GHR gene expression in lung tissues of healthy and individuals with ILD or IPF (Ctrl, n = 136; ILD, n = 255; IPF, n = 68) in LGRC cohort. (B and C) Representative images of immunofluorescence (B) and quantitative analysis (C) for the protein levels of GHR in lung tissues of healthy and IPF individuals. (D and E) RNAscope analysis (D) and quantitative analysis (E) for the RNA levels of GHR in lung tissues of healthy and IPF individuals. (F) Representative confocal microscopy GHR immunostaining for IPF lung tissues shows decreased GHR protein expression in severe fibrotic area of IPF lung tissues. (G) Quantification of Ghr protein expression with DNA stain [4′,6-diamidino-2-phenylindole (DAPI), blue] from staining in (F). (H) Pearson correlation coefficients of FEV1 and FVC before bronchodilator (bd) and DLCO as a function of GHR gene expression in the lungs of patients with IPF. R and P values, as well as the numbers of patients analyzed, are indicated in the figures. Scale bars, 100 μm (D), 200 μm (B), and 500 μm (F). ****P < 0.0001 by unpaired two-tailed Student’s t test, Bars represent means ± SEM.
