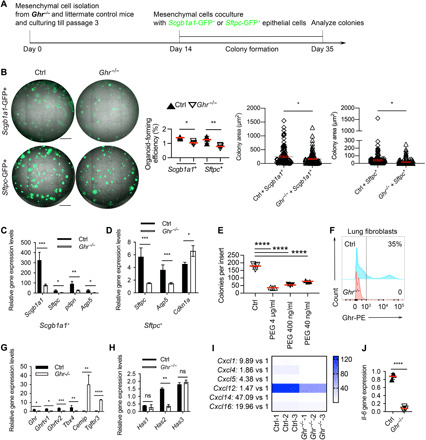
Fig. 4. Ghr-deficient mesenchymal cells are less supportive for epithelial progenitor cell colony formation.

(A) Schematic of in vitro coculture colony formation assay for experiments in (B) to (D). (B) Scgb1a1-GFP+ (green fluorescent protein–positive) Club cell and Sftpc-GFP+ ATII organoids cocultured with mesenchymal cells isolated from Ghr−/− or control mouse lungs. The number and size of Scgb1a1-GFP+ Club cell and Sftpc-GFP+ ATII organoids were decreased when cocultured with Ghr−/− mesenchymal cells. (C) Expression of Scgb1a1, Sftpc, Pdpn, and Aqp5 in Scgb1a1+ Club cell organoids cocultured with lung mesenchymal cells isolated from Ghr−/− and control mice. (D) Expression of Sftpc, Pdpn, and Cdkn1a in Sftpc+ ATII cell organoids cocultured with lung mesenchymal cells isolated from Ghr−/− and control mice. (E) Pegvisomant (PEG) treatment for mesenchymal cells cocultured with ATII colonies. (F) FACS confirmation of Ghr expression on lung mesenchymal cells from Ghr−/− and control mice. (G) Ghr, Ghr TV1, Ghr TV2, Tbx4, Cemip, and Tgfbr3 expression in lung mesenchymal cells from Ghr−/− and control mice. (H) Has1, Has2, and Has3 expression in lung mesenchymal cells from Ghr−/− and control mice. (I) Chemokine gene (Cxcl1, Cxcl4, Cxcl5, Cxcl12, Cxcl14, and Cxcl16) expression in Ctrl and Ghr−/− mouse lung mesenchymal cells. (J) Il-6 gene expression in lung mesenchymal cells from Ghr−/− and control mice. Scale bars, 1 mm (B). n = 3, *P < 0.05, **P < 0.005, ***P < 0.001, and ****P < 0.0001 by unpaired two-tailed Student’s t test [B (panels 3 and 4) and J], one-way analysis of variance (ANOVA) (E), and two-way ANOVA [B (panel 2), C, D, G, and H], means ± SEM.
