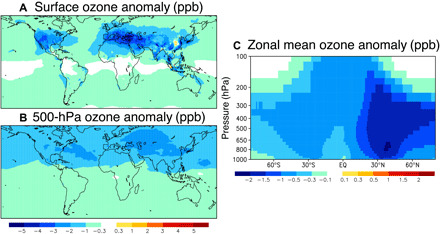
Fig. 5. Monthly ozone changes due to the COVID NOx emission reductions in May 2020.

Spatial distribution of the ozone anomaly (in ppb) at (A) the surface, (B) 500 hPa, and (C) zonal mean values in latitude-pressure coordinates. EQ, equator.

Spatial distribution of the ozone anomaly (in ppb) at (A) the surface, (B) 500 hPa, and (C) zonal mean values in latitude-pressure coordinates. EQ, equator.