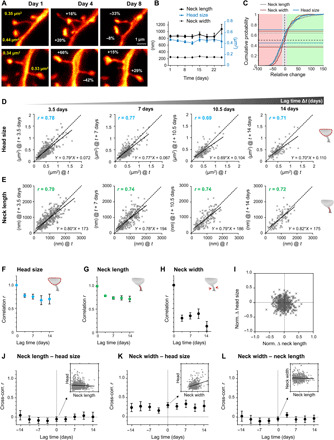
Fig. 4. In stable spines, head size and neck length fluctuate independently and are more persistent than fluctuations in neck width, while changes in head size and neck width do correlate.

(A) Representative examples of changes in spine head size. (B) The morphological parameters are stable over the observation period of 24 days. Data are means ± SEM. (C) Cumulative distribution of relative changes of neck length (gray), neck width (red), and spine head size (blue) over 3 to 4 days. Fraction of spines that changed spine head size within ±10% (gray area) is indicated by blue horizontal lines, while the same for neck length is indicated by gray and for neck width by red horizontal lines (light red area denotes relative change in size to lower than −10%, while changes exceeding 10% are indicated by the green area). (D and E) Head size (D) and neck length (E) after four different time intervals Δt plotted against their size at time t. Straight line is a linear regression, r is the Pearson’s correlation coefficient, and dashed is the line of unity. (F to H) Pearson’s correlation coefficient plotted over lag time Δt for head size (F), neck length (G), and neck width (H). (I) Normalized changes of head size and neck length are not correlated. (J to L) Pearson’s cross-correlation between different spine parameter for different lag times. Neck length to head size (J) and neck length to neck width (L) are uncorrelated, while neck width to head size (K) shows a significant correlation for up to 14 days. Inset scatter plot and linear regression at lag time Δt = 0 for illustration. (F to H and J to L). Error bars are SD of bootstrapped data. (B to L) All data of the same time interval were pooled. Numbers of analyzed spines are listed in table S1.
