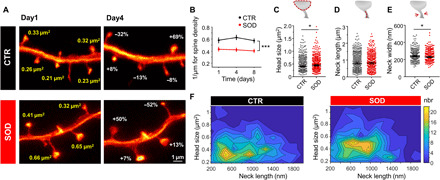
Fig. 6. Nanoscopy in SOD transgenic mice.

(A) Representative example of a GFP-expressing dendrite in a CTR and a SOD transgenic mouse showing changes in spine head size within 3 days (images are maximum intensity projections). (B) CTR mice show higher spine density than SOD mice. (C to F) Changes in spine parameter. While the head size (C) of stable spines was increased in SOD mice, no difference was observed in neck length (D), but neck width (E) was decreased in SOD mice. (F) Contour plot of head size and neck length shows a shift to larger head sizes for SOD mice (nbr, number). *P < 0.05. Data in (B) are means ± SEM and in (C to E) are median ± 95% CI. Numbers of analyzed spines are listed in table S1. Data were pooled.
