
Fig. 2. STXM images, metal maps, and copper and iron x-ray absorption spectra from a subject Y amyloid plaque.
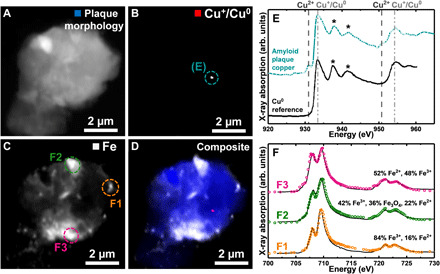
(A) STXM image showing the overall plaque morphology. (B) Cu+/Cu0 map. (C) Iron map. (D) Composite STXM image showing plaque morphology (blue), Cu+/Cu0 (red), and iron (gray) content. (E) Copper x-ray absorption spectrum from the copper area highlighted in (B) (cyan trace) and a Cu0 reference (black trace). Reprinted from Jiang et al. (42) with the permission of AIP Publishing. The energies corresponding to Cu2+ and Cu+/Cu0 content are shown by the dashed and dotted-dashed lines, respectively. Asterisks highlight extended x-ray absorption fine structure (EXAFS) indicative of metallic copper (Cu0). (F) Iron x-ray absorption spectra from the areas highlighted in (C).