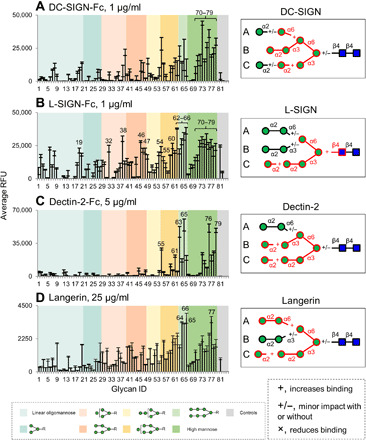
Fig. 4. Distinct binding selectivity of the innate immune receptors to oligomannose glycans.

(A to D) Microarray analysis of human IgG Fc-tagged DC-SIGN (A), L-SIGN (B), and Dectin-2 (C) and His-tagged Langerin (D) on oligomannose array. Detection was with Alexa Fluor 488–labeled goat anti-human IgG, Cy3-labeled goat anti-human IgG, or mouse anti-His IgG followed by Alexa Fluor 633–labeled goat anti-mouse IgG (H+L). Results are shown as relative fluorescence units (RFUs) by averaging the background-subtracted fluorescence signals of four replicate spots; error bars represent the SD among the four values. The glycans are arranged by their structural features and color-coded as listed at the bottom. Binding preferences of the corresponding proteins to oligomannose glycans deduced from microarray analyses are shown on the right. The epitopes common to the top binders are highlighted in red, with +, +/−, and × suggesting that the presence of the corresponding structures increases, not changes, or decreases the binding intensities.
