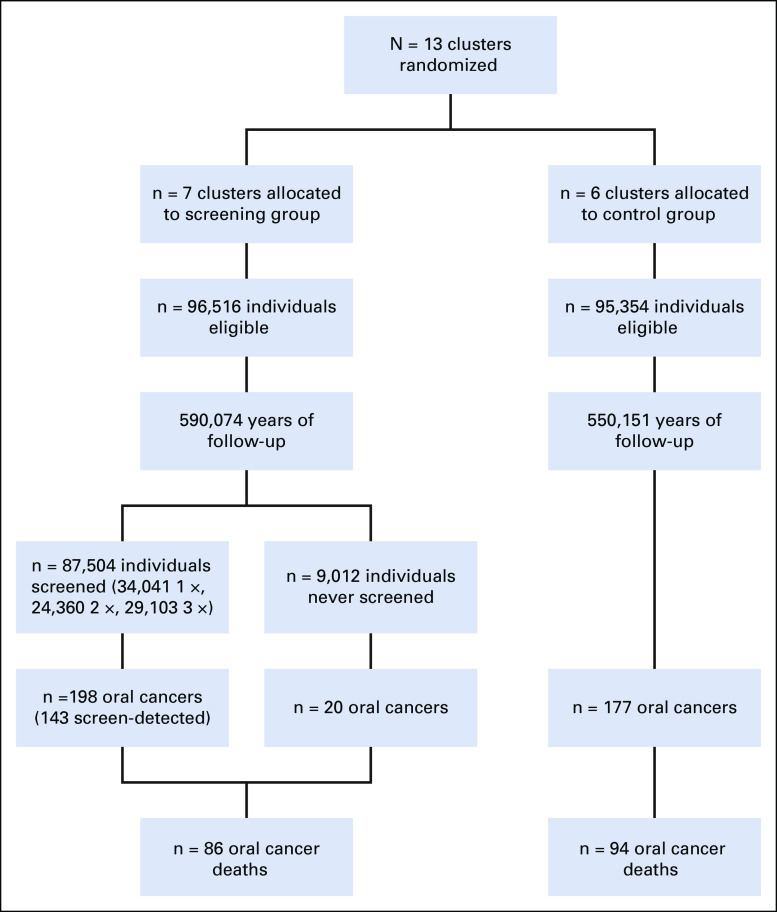
FIG 1.
CONSORT diagram. The figure depicts the number of clusters, individuals, years of follow-up, screening visits (for the screening group), oral cancers diagnosed, and oral cancer deaths in the screening and control arms of the Kerala trial. The number of screen-detected cancers reported is the number with positive screening results. Of note, the number of participants (n = 3) and number of oral cancer events (n = 32 oral cancers and n = 16 oral cancer deaths) differ between our analysis and the 2005 report by Sankaranarayanan et al. These differences arise from the exclusion of duplicate participants (n = 3) and data updates available from additional follow-up.

